Single-indicator trading strategies and rigid deriv bots fail far too often on volatile synthetic indices. Taking a buy trade simply because an RSI dips into oversold territory usually leads straight into a continuation of a steep downward trend. Establishing a disciplined approach to indicator confluence trading solves this issue by requiring multiple independent technical indicators to confirm a setup before placing orders. When trend, momentum, vector, and volatility align simultaneously, trade setups receive structural confirmation while unconfirmed false breakouts get filtered out.
Running this manual verification process across every open chart requires constant focus, leading to mental fatigue and missed execution windows. Nextrader (Nextrader App) automates the analytical workload through real-time algorithmic scanning of live market data feeds. By utilizing Nextrader's deriv trading tools, traders can instantly surface high-probability setups without spending hours toggling between overlapping technical indicators across Volatility 10 (V10), Volatility 75 (V75), or Volatility 100 1s (1Hz) synthetic indices.
The platform's engine evaluates live tick feeds directly through Deriv's WebSocket API, executing multi-indicator scoring matrices exclusively on completed candle closes. Rather than guessing whether a setup possesses sufficient confirmation, you receive real-time deriv trading signals through Nextrader Signals showing an explicit Confluence % metric alongside pre-calculated risk parameters.
The Checklist
- Select your target market and timeframe (1m, 5m, 15m, 1h) on the Nextrader Signals page.
- Ensure signal evaluation strictly occurs on a CLOSED candle to eliminate repainting false alarms.
- Cross-reference the 4 core confluence pillars: EMA trend, RSI momentum, MACD crossover, and Bollinger Band expansion.
- Verify the signal card shows a STRONG rating and a high Confluence % threshold using the Smart Signals or Smart Fusion filter.
- Open the Quick Trade panel to populate pre-filled Stop Loss, Take Profit, and suggested risk/reward ratios.
- Execute your Rise/Fall or Multipliers (e.g., x100) contract and track live execution in the Active Trades table.
- 1 Select synthetic index market and timeframe on Nextrader App
- 2 Wait for completed candle close to generate non-repainting signal
- 3 Filter for Smart Signals with 4+ agreed indicators and high Confluence %
- 4 Launch Quick Trade modal with pre-filled Stop Loss and Take Profit
- 5 Execute Rise/Fall or Multipliers x100 trade and monitor via Active Trades
How Indicator Confluence Trading Eliminates False Breakouts
1. Select your target market and timeframe on Nextrader Signals
Log into Nextrader App and navigate to the Signals page. The Nextrader ecosystem scans across synthetic indices (V10, V25, V50, V75, V100, and 1Hz series), forex, commodities, and cryptocurrencies. Selecting the right index and timeframe dictates your trade duration and risk profile.
Get Live AI Trading Signals
Real-time non-repaint signals from 11 AI strategies — Volatility Indices, Forex, Gold & Crypto. No subscription, no paywall.
- Auto Trader Bot
- Digit Trader Bot
- 11 AI Strategies
- Live Telegram Signals
On Nextrader's scanner, 1m and 5m timeframes highlight fast scalping opportunities on high-volatility indices like Volatility 75 Index or Volatility 100 1s Index. Intraday traders can switch to 15m or 1h timeframes where larger trend structures develop with less market noise. The Signals page centralizes active market feeds into clear visual cards so you can monitor multiple synthetic indices simultaneously.
2. Confirm closed-candle signal generation to eliminate repainting
Nextrader eliminates repainting by enforcing strict candle-close execution rules. The platform's backend algorithm scans live markets on every tick, but it strictly waits for the candle timer to reach zero (00:00) before running indicator scoring routines. If a signal fires on a 5m timeframe, every indicator calculation—from the Relative Strength Index to Exponential Moving Averages—is locked in based on the definitive closing price of that 5-minute candle.
This ensures that the Confluence % displayed on your Nextrader dashboard reflects fixed historical price reality rather than transient intra-candle fluctuations.
3. Evaluate multi-indicator alignment across the 4 pillars
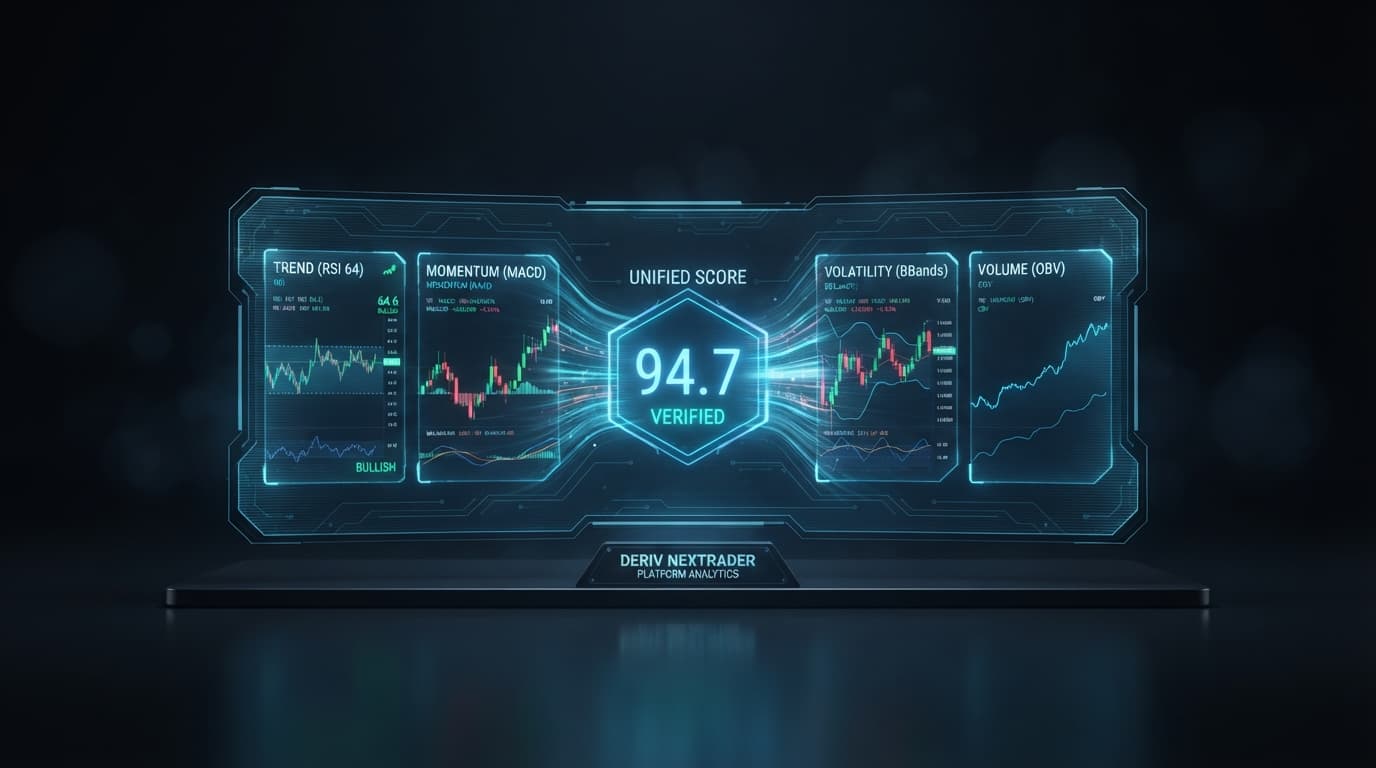
True confluence requires combining technical indicators that measure fundamentally different aspects of price action. Nextrader structures its signal logic across four non-correlated analytical pillars, reinforced by automated candlestick pattern detection:
- EMA (Trend Hunter): Exponential Moving Averages establish the directional baseline. The Trend Hunter strategy verifies whether current price sits above or below key moving averages, ensuring you trade strictly in the direction of the dominant macro trend.
- RSI (Reversal Radar): The Relative Strength Index measures velocity and momentum magnitude. The Reversal Radar strategy checks that price is not overextended into extreme overbought or oversold territory, confirming room for price to move toward its target before hitting structural exhaustion.
- MACD (Momentum Wave): Moving Average Convergence Divergence tracks changes in momentum strength and direction. The Momentum Wave strategy validates signal line crossovers and expanding histogram bars, confirming buying or selling pressure supports the directional move.
- Bollinger Bands (Volatility Pulse): Bollinger Bands measure dispersion and market volatility. The Volatility Pulse strategy confirms whether price is breaking out of a squeezed band condition or interacting with outer volatility envelopes, signaling an expansion phase required to reach profit targets.
When these four pillars align alongside a recognized candlestick pattern (such as a bullish engulfing candle or a pin bar at structural support), the signal achieves multi-layer structural confirmation.
4. Filter false breakouts using Nextrader AI trading signals and confluence metrics
Understanding how to read and filter the signal cards on Nextrader App keeps low-probability trades off your execution ledger. Every generated signal card delivers clear telemetry:
- Direction: UP (Call/Long) or DOWN (Put/Short).
- Strength: Categorized as STRONG when a critical mass of indicators confirm the move.
- Timeframe: Displays the specific completed candle period (1m, 5m, 15m, 1h).
- Confluence %: An algorithmic score calculating the exact percentage of underlying indicators agreeing on directional bias.
- Triggered Indicators: An explicit list showing which strategy engines (e.g., Trend Hunter, Reversal Radar, Momentum Wave, Volatility Pulse, Swift Scalper, Trend Rider, Cloud Walker, Price Magnet, Breakout Beast) passed verification.
To maximize filter efficiency, utilize the app's predefined strategy presets. Selecting the Smart Signals filter limits your view exclusively to setups where 4 or more independent indicators agree simultaneously. Alternatively, applying the Smart Fusion filter evaluates complex multi-indicator combinations to catch early momentum shifts without sacrificing strict confluence thresholds.
Setups displaying low Confluence % or mixed indicator triggers must be rejected. If Trend Hunter indicates an upward trend but Momentum Wave demonstrates declining MACD histogram bars, the signal card will reflect a lower confidence metric. Filtering out these conflicting cards prevents you from entering choppy, range-bound markets where stop losses are easily hit.
5. Launch Quick Trade with pre-filled SL/TP and risk/reward controls
Once a high-confluence signal card generates on the Signals page, clicking directly on the card opens the integrated Quick Trade panel confirmation modal. This connects technical confluence directly to order execution without requiring manual input of price levels.
Within the Quick Trade modal, select your trade contract structure:
- Multipliers: Capture directional moves with defined downside risk and amplified returns. Set your stake and multiplier (e.g., x100 multiplier) to define trade scaling.
- Rise/Fall: Select fixed-payout digital contracts based on whether price will end higher or lower over your selected duration.
The Quick Trade panel automatically reads the underlying AI signal data and pre-fills your exact Stop Loss and Take Profit price levels. The confirmation modal displays the suggested stake alongside the calculated risk/reward ratio (e.g., 1:2 or better). Review these parameters to confirm they align with your capital rules, then click UP or DOWN to execute the trade immediately via Deriv's API.
6. Manage active trades using live P/L tools
Tracking active position metrics ensures risk control remains active until exit. Open the Active Trades table at the bottom of the Nextrader interface to monitor open positions in real time.
The Active Trades table streams live Profit/Loss (P/L) updates directly from the WebSocket connection. If an active trade approaches your target but market conditions shift—such as a sudden surge in counter-trend volatility flagged on the Market Overview table (which updates prices every 10 seconds)—you retain full control to execute an early close. Locking in realized gains before a structural reversal preserves equity and maintains disciplined risk management.
Common Mistakes
- Trading mid-candle on forming prices: Entering a position while a candle is actively forming exposes your balance to repainting errors. A chart spike mid-candle can make RSI appear overbought or MACD look crossed, only for price to retract before the candle closes. Correction: Evaluate setups exclusively after the candle timer reaches zero and Nextrader issues a confirmed signal card on the closed candle.
- Ignoring indicator disagreement: Taking a trade when only 2 out of 4 indicators align—often driven by Fear Of Missing Out (FOMO)—drastically lowers signal accuracy. Correction: Maintain mechanical discipline by filtering exclusively for Smart Signals or cards demonstrating high Confluence % with 4+ fully aligned indicators.
- Overriding pre-filled risk parameters: Deleting automated Stop Loss boundaries or vastly inflating your multiplier stake on single trades bypasses structural risk management. Correction: Accept the pre-filled AI Stop Loss and Take Profit targets established in the Quick Trade panel modal, adhering strictly to the calculated risk/reward ratio.
Start Now
Eliminating false breakouts requires moving away from single-indicator guessing games and adopting a structured, multi-indicator workflow. By scoring real-time trend, momentum, vector, and volatility metrics on completed candle closes, indicator confluence trading brings structure and discipline to synthetic indices execution.
Launch the free tools at Nextrader App today to test non-repainting AI signals on live markets. You can create your free account directly at Sign Up Free — Nextrader and review step-by-step indicator documentation at Nextrader App. Join our growing community of traders on Telegram at Telegram to share strategies and market insights.
Trading involves risk. Past performance does not guarantee future results.