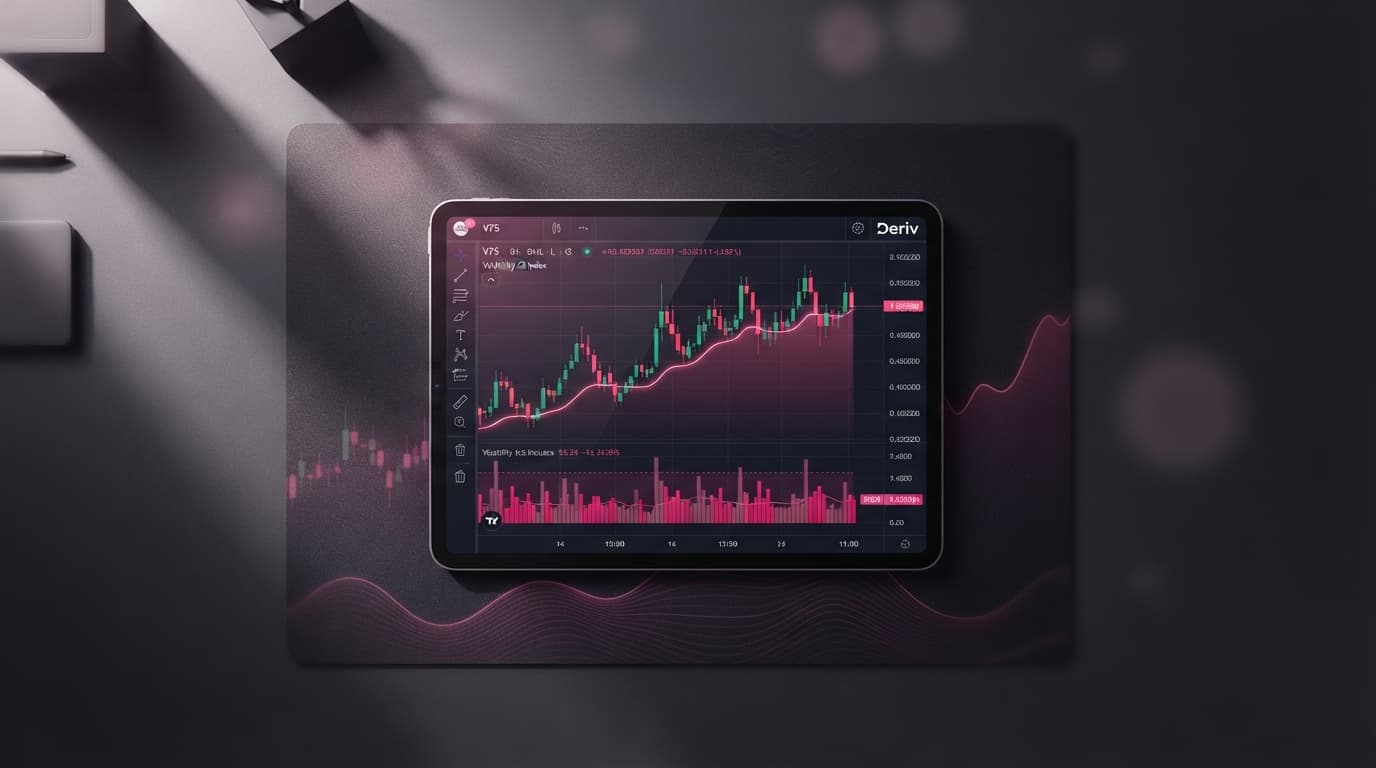

MACD Divergence Masterclass for Deriv Traders
Mastering structural macd divergence provides a clear technical edge for evaluating momentum exhaustion and identifying high-probability reversal points on continuous markets. On Deriv synthetic indices, where liquidity flows 24/7 without market sessions or daily closes, tracking momentum shifts prevents traders from chasing extended trends right before a market reversal.
Identifying structural momentum shifts on 24/7 synthetic assets—such as Volatility 75 (V75) or the rapid 1Hz index series—requires strict technical rules rather than vague visual guesses. Continuous synthetic liquidity never closes, meaning price trends can extend far beyond standard oversold or overbought levels. When raw price trajectory diverges from underlying oscillator momentum, macd divergence reveals well-defined entry setups with structured reward-to-risk ratios.
Validating these subtle structural shifts demands objective peak-to-price calculations, disciplined zero-line entry triggers, and dynamic volatility-adjusted stops. Performing this level of precision analysis requires dedicated charting tools engineered specifically for continuous synthetic markets. Using NexTrader Charts, traders can plot peak structures, monitor sub-minute price movements, and configure real-time alerts across all Deriv synthetic indices and forex pairs.
Regular vs. Hidden MACD Divergence: Precise Peak-to-Price Validation
Divergence occurs when market price action and oscillator momentum decouple. To trade this setup effectively on 24/7 synthetic indices, you must distinguish between regular divergence, which signals potential trend reversals, and hidden divergence, which signals trend continuation.
Analyze Deriv Markets Free
Pro-grade Deriv charts with 100+ indicators — RSI, MACD, Bollinger, Ichimoku. Synthetic indices, forex & crypto.
- 100+ Indicators
- Price Alerts
- All Timeframes
- Free Forever
To conduct accurate deriv chart analysis, load the standard Moving Average Convergence Divergence indicator parameters alongside the Average True Range:
- Fast EMA: 12
- Slow EMA: 26
- Signal Line: 9
- ATR Period: 14
- Chart Timeframes: 1-minute (1m), 5-minute (5m), and 15-minute (15m)
Applying these settings on NexTrader Charts ensures clear visualization across fast-moving synthetic contracts.
Regular Bearish Divergence (Reversal Rule)
A regular bearish divergence develops at the end of an extended uptrend. Price action prints a Higher High (HH), but the MACD Line or MACD Histogram prints a Lower High (LH). This structural misalignment signals that buying momentum is fading despite higher market prices.
To validate a regular bearish divergence on NexTrader Charts:
- Use the trendline drawing tool to connect two consecutive price peaks where Peak 2 is higher than Peak 1.
- Project a line directly down to the MACD window to connect the corresponding oscillator peaks.
- Confirm that MACD Peak 2 is strictly lower than MACD Peak 1.
Hidden Bullish Divergence (Continuation Rule)
Hidden divergence occurs during an established macro uptrend when price pulls back. Price action forms a Higher Low (HL), while the MACD Line forms a Lower Low (LL). This pattern reveals that selling pressure was aggressive enough to push the indicator down, yet buyers stepped in at a higher structural price floor, confirming underlying trend strength.
Histogram vs. MACD Line Divergence Mechanics
Understanding the difference between histogram peaks and MACD line peaks is crucial on high-volatility assets like Volatility 75 (V75) and Volatility 100 (V100). The MACD Histogram measures the distance between the MACD line and its signal line. Consequently, histogram divergence acts as an early warning mechanism, displaying momentum deceleration while price is still pushing forward.
In contrast, MACD Line divergence requires the actual exponential moving average differential to shift. While MACD Line signals occur less frequently, they provide much stronger structural confirmation of sustained trend reversals across synthetic indices.
Master Deriv Chart Analysis with Zero-Line Confirmation and ATR Stops
A common mistake when trading macd divergence is entering a trade immediately after identifying a visual discrepancy. On volatile 24/7 synthetics, momentum can remain diverged while price continues to trend aggressively against your position, leading to severe drawdown. Incorporating zero-line filtering and volatility-based stop placements eliminates premature counter-trend entries.
The Zero-Line Trigger Rule
To filter out false signals during strong trend extensions, apply the Zero-Line Trigger Rule. Under this rule, a divergence signal remains unconfirmed until the main MACD Line crosses back over the zero threshold post-divergence confirmation.
- Short Entry Trigger (Post Bearish Divergence): Wait for the MACD Line to cross from above zero to below zero. Alternatively, aggressive traders on lower timeframes can use a MACD Line cross below the Signal Line, provided the cross occurs after peak confirmation.
- Long Entry Trigger (Post Bullish Divergence): Wait for the MACD Line to cross from below zero to above zero.
By demanding zero-line confirmation on deriv charts, you ensure that actual directional momentum has turned in your favor before placing a trade with your Deriv broker account.
Calculating Dynamic ATR Stop Placements
Static point or pips-based stop losses fail on synthetic indices because each volatility asset operates with distinct price scales and step sizes. Volatility 10 (V10) exhibits low variance, while Volatility 100 (V100) experiences sharp, wide candle spans.
Using technical analysis centered around the Average True Range (ATR) normalizes risk across all assets.
$$\text{Stop Loss Distance} = 1.5 \times \text{ATR}(14)$$
- Identify the exact extreme swing peak (for shorts) or extreme swing trough (for longs) that formed the divergence pattern.
- Read the current value of the 14-period ATR on NexTrader Charts at the entry candle.
- Multiply the ATR(14) value by 1.5.
- For short positions, add this product to the swing peak price. For long positions, subtract this product from the swing trough price.
This $1.5 \times \text{ATR}(14)$ buffer ensures your position survives natural market noise while protecting your equity if structural invalidation occurs. Take-profit targets should be placed at key structural support or resistance zones identified on higher timeframes (such as the 15m or 1-hour charts).
Executing and Managing Divergence Trades on NexTrader Charts
NexTrader Charts provides a professional, 100% free charting workspace engineered specifically for Deriv traders analyzing 24/7 markets.
Setting Up Your Divergence Workstation
- Launch NexTrader Charts and select your target instrument from the market navigator—such as Volatility 10 (V10), Volatility 25 (V25), Volatility 50 (V50), Volatility 75 (V75), Volatility 100 (V100), or 1Hz series index contracts.
- Set your primary operational timeframe to 5m for entry timing, keeping a 15m chart open for macro structure mapping.
- Open the Indicators menu and add MACD (12, 26, 9) and ATR (14) to your workspace.
- Save your layout as a custom template (e.g., "MACD Divergence System") so your technical analysis indicators, drawing tools, and color schemes load instantly whenever you return.
Configuring Real-Time Price and Indicator Alerts
Because synthetic indices trade continuous 24/7 liquidity, high-probability divergence signals can occur at any hour. Rather than staring at screen charts continuously, set custom automated alerts directly within the browser interface.
Right-click the MACD zero-line threshold or the signal line boundary on NexTrader Charts to set an alert. You can configure notifications to trigger the moment the MACD line crosses the zero level following a peak divergence setup. This ensures you only review the chart when strict entry criteria are fully satisfied.
Multi-Timeframe Alignment and Asset Tracking
Check higher timeframes (such as the 15-minute or 1-hour charts) on NexTrader Charts to verify that your lower-timeframe divergence aligns with overall macro market structure. If a regular bullish divergence appears on the 5-minute chart while the 1-hour chart rests at a major support zone, the probability of a successful trade expansion increases significantly.
By systematically applying peak-to-price validation math, zero-line entry triggers, and dynamic ATR risk controls on NexTrader Charts, manual traders gain a clear, repeatable execution method across all Deriv synthetic and forex markets.
Ready to trade divergence with precision charts? Launch your workspace on NexTrader Charts and join our active Telegram community at Telegram.
Trading involves risk. Past performance does not guarantee future results.