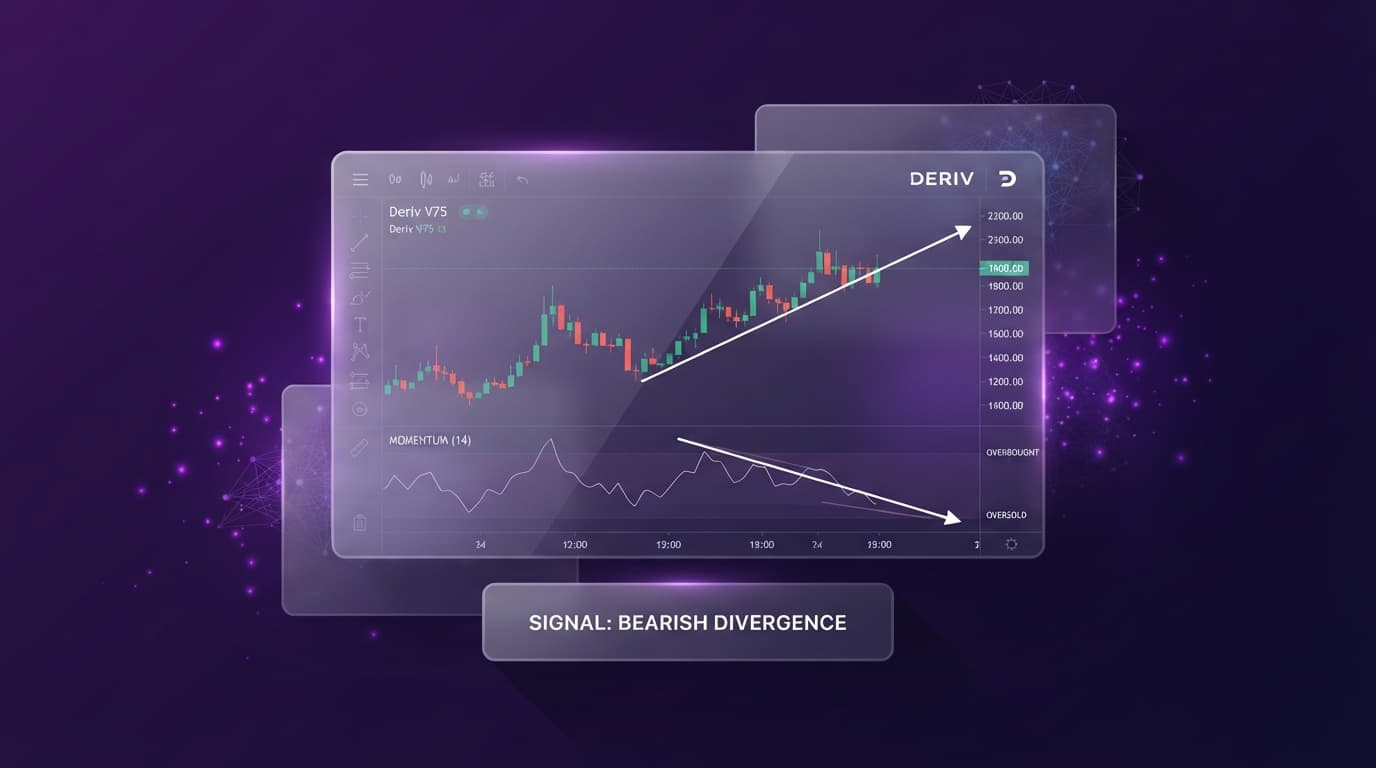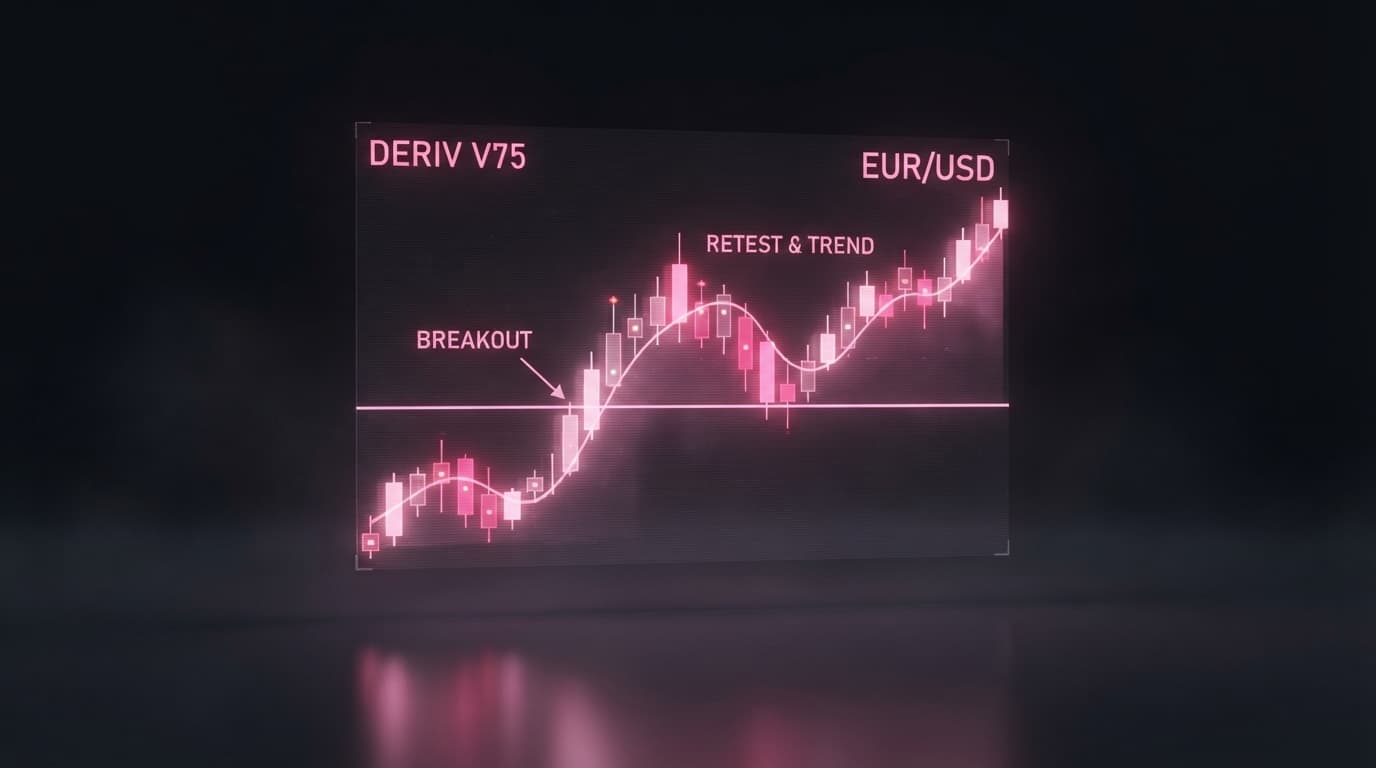
Trading market momentum on synthetic indices like Volatility 75 (V75) requires clear rules to avoid fakeouts. The break and retest strategy provides a systematic framework for capturing high-probability directional moves by validating support and resistance flips before entering a position. Waiting for an H1 candle body to close beyond a mapped structural level before taking action converts fast price movements into quantified setups. Performing your NexTrader chart analysis on NexTrader Charts (NexTrader Charts) gives you access to real-time tick-by-tick feeds, multi-timeframe drawing tools, and over 100 built-in indicators without paywalls or subscription costs.
Continuous 24/7 price feeds on Volatility synthetics mean key support and resistance lines hold structural validity without weekend gap interruptions. Combining precise H1/H4 horizontal line mapping with mechanical indicators like the 14-period Relative Strength Index (RSI) and Average True Range (ATR) filters out low-quality entries. Utilizing professional NexTrader trading tools allows you to plan your entries on M5/M15 rejection candles, place rigid 1.5x ATR stop-losses, and secure mathematical 1:2 risk-to-reward ratios on every setup.
The key to mastering this methodology is multi-timeframe alignment. You use higher timeframes to map primary supply and demand zones, wait for full candle body validation, and then drop to lower timeframes for execution signals. Here is how to execute this exact strategy from start to finish on NexTrader Charts.
Mapping High-Probability Level Breaks on H1/H4 Deriv Charts
Before executing any trade, your primary objective is to establish where major price action flips occur on higher timeframes. Open NexTrader Charts (NexTrader Charts) and set your workspace to the H4 or H1 timeframe. Select popular synthetic assets such as Volatility 75 (V75) or Volatility 100 (V100), which exhibit clean trend structures and heavy momentum expansion.
Analyze Deriv Markets Free
Pro-grade Deriv charts with 100+ indicators — RSI, MACD, Bollinger, Ichimoku. Synthetic indices, forex & crypto.
- 100+ Indicators
- Price Alerts
- All Timeframes
- Free Forever
Use the horizontal line drawing tool on NexTrader Charts to mark key structural levels where price has clearly turned at least twice in recent history. A valid level on NexTrader charts represents a zone where buyers or sellers previously stepped in with substantial volume. To maintain visual clarity across multi-timeframe analysis, customize your line styles—using thick, solid lines for H4 major key levels and dashed lines for H1 structural pivots. NexTrader Charts enables you to save your custom chart layouts as reusable templates, ensuring your mapped support and resistance zones persist whenever you start a new trading session.
Qualifying True Breaks vs. Fakeout Wicks in a Break and Retest Strategy
The most common trap traders fall into when executing a break and retest strategy is buying or selling a level break prematurely. A long wick spiking past a resistance line is not a breakout; it is often a liquidity sweep that quickly reverses.
To qualify a breakout as legitimate on NexTrader Charts:
- H1 Candle Close Requirement: You must wait for the current H1 candle to close completely outside the horizontal line.
- Bullish Breakout: The entire candle body (or at least 80% of its range) must close above the resistance level.
- Bearish Breakout: The H1 candle body must close firmly below the support level.
If an H1 candle spikes past your marked zone on V100 but pulls back to close inside the range, leaving a long upper wick, the breakout has failed. Do not look for retests on failed breaks. Only when the H1 candle closes beyond the key structural line does the broken level become a valid retest target zone on NexTrader Charts.
Confirming the Retest Trigger on M5/M15 Timeframes
Once the H1 candle confirms a structural break, you do not place a market order immediately. Instead, you wait for price to return to the broken level—turning prior resistance into new support, or prior support into new resistance.
To capture the retest, switch your view on NexTrader Charts (NexTrader Charts) down to the lower timeframes: M15 or M5. Lower timeframes reveal the precise micro-structure as price retraces toward your mapped line.
- 1 Map H1/H4 support or resistance on NexTrader Charts
- 2 Confirm full H1 candle body close past structural level
- 3 Switch to M5/M15 timeframe and await price retest to broken line
- 4 Verify RSI (14) confirmation (>50 bullish / <50 bearish)
- 5 Execute trade on M5/M15 rejection candle (pin bar or engulfing)
Rejection Candle Execution Patterns
As price returns to touch the broken structure line on M5 or M15, you must see active price rejection before entering. Never place blind limit orders directly on the line. Look for specific candlestick patterns forming right on or near the level using NexTrader Charts:
- Pin Bar / Hammer: A candle featuring a long tail pointing toward the broken level, showing aggressive defense by market participants.
- Bullish/Bearish Engulfing: A candle that completely swallows the previous candle's body away from the retest level, signifying momentum resumption.
Momentum Filtering with Technical Analysis and the RSI Indicator
To increase the probability of your setup, combine price action rejections with mathematical momentum filters on NexTrader Charts. Add the Relative Strength Index (RSI) indicator from the built-in library of 100+ technical indicators and configure its period setting to 14.
When conducting your technical analysis during the M5/M15 retest:
- Bullish Retest Condition: The RSI (14) value on NexTrader Charts must be holding above 50. An RSI above 50 confirms that buyers retain overall control despite the temporary pull-back.
- Bearish Retest Condition: The RSI (14) value must be sitting below 50. An RSI below 50 confirms underlying bearish momentum as price retests broken support from below.
If price touches the broken line on an M15 chart but the RSI is lingering below 40 during a long setup, momentum has deteriorated too heavily, signaling a higher chance of a total failure back into the previous range.
Mechanical Trade Execution: ATR Stop-Losses and Target Management
A disciplined trading strategy relies on objective risk management rules rather than arbitrary pip stops. Volatility synthetic indices like V10, V25, V50, V75, and V100 have vastly different tick scales and price ranges. Using fixed-pip stop-losses across different volatility assets guarantees premature stop-outs.
Instead, calculate dynamic volatility-based risk parameters using the Average True Range (ATR) indicator built directly into NexTrader Charts (NexTrader Charts).
Dynamic Stop-Loss Calculation (1.5x ATR Rule)
Apply the ATR indicator set to 14 periods on your M15 chart in NexTrader Charts. The ATR calculates the exact average volatility range of recent candles.
Follow this rigid calculation for stop placement:
- Identify the high or low of the M5/M15 rejection candle structure at the retest zone.
- Note the current M15 ATR (14) reading on NexTrader Charts.
- Multiply the ATR value by 1.5.
- Long Trade SL: Place your stop loss 1.5x ATR below the swing low of the rejection candle.
- Short Trade SL: Place your stop loss 1.5x ATR above the swing high of the rejection candle.
For example, if you are trading a bullish retest on V75 on the M15 timeframe, and the rejection candle low is 450,000 with an ATR reading of 2,000 points:
- Stop Buffer = 2,000 * 1.5 = 3,000 points.
- Stop Loss Price = 450,000 - 3,000 = 447,000.
This 1.5x ATR buffer gives the synthetic index enough room to breathe during micro-fluctuations without exposing your account to excessive downside.
Target Management and Risk-to-Reward Ratios
Exit management must be completely mechanical. When you open a trade on continuous 24/7 synthetic indices (V10, V25, V50, V75, V100) or major forex pairs, define your targets before execution using the drawing tools on NexTrader Charts:
- Take-Profit 1 (TP1): Set TP1 at a strict 1:2 Risk-to-Reward (R:R) ratio relative to your 1.5x ATR stop distance. Once price reaches TP1, lock in partial profits and move your stop-loss to entry (breakeven).
- Take-Profit 2 (TP2): Set TP2 at the next major H1 structural high (for longs) or H1 structural low (for shorts) previously mapped on NexTrader Charts.
Managing Positions with Real-Time Price Alerts
Because synthetic markets trade around the clock, set custom price alerts directly inside NexTrader Charts (NexTrader Charts) near key H1 structural levels. When price reaches your configured alert threshold, evaluate whether an H1 candle close has occurred beyond structure, switch down to M15, and verify if the RSI (14) filter and 1.5x ATR rules align.
Tracking alert triggers at major H1 support and resistance boundaries keeps your analysis structured and eliminates manual screen fatigue across 24/7 synthetic index charts.
Ready to upgrade your trading workflow with professional analytical tools? Access 100+ free technical indicators, real-time 24/7 synthetic index feeds, and professional charting tools without paying a subscription fee. Open NexTrader Charts today to build your custom chart templates, or launch the complete platform on NexTrader App. Join thousands of active traders in our growing Telegram to discuss daily market setups and automated strategies.
Trading involves risk. Past performance does not guarantee future results.