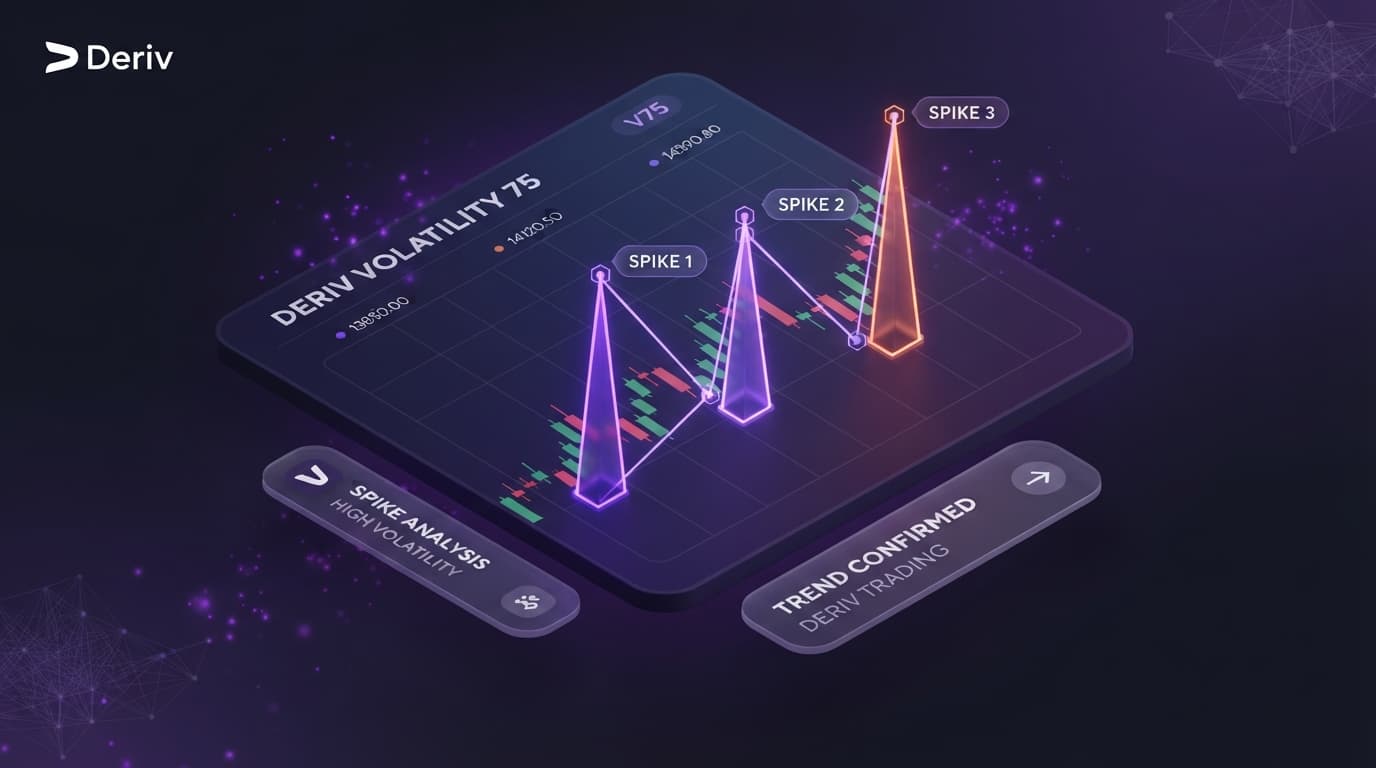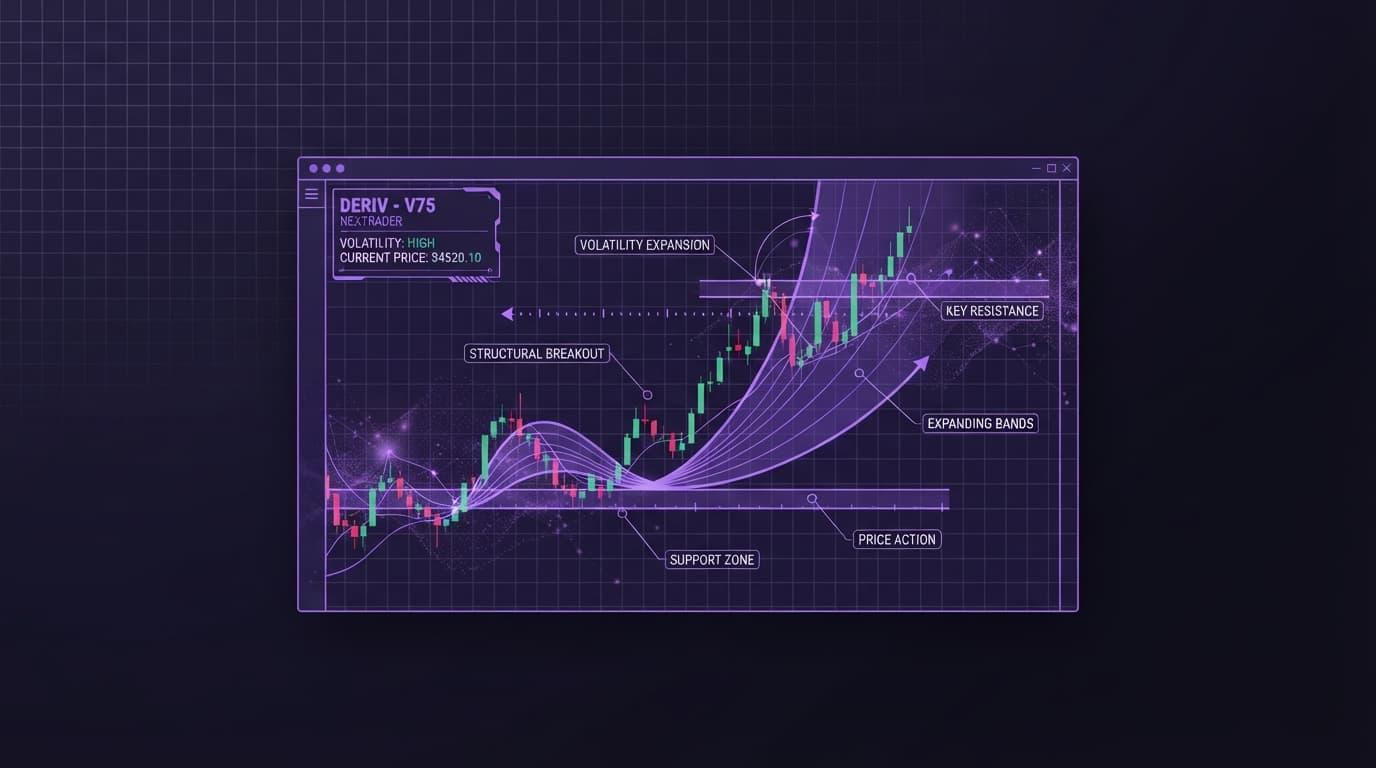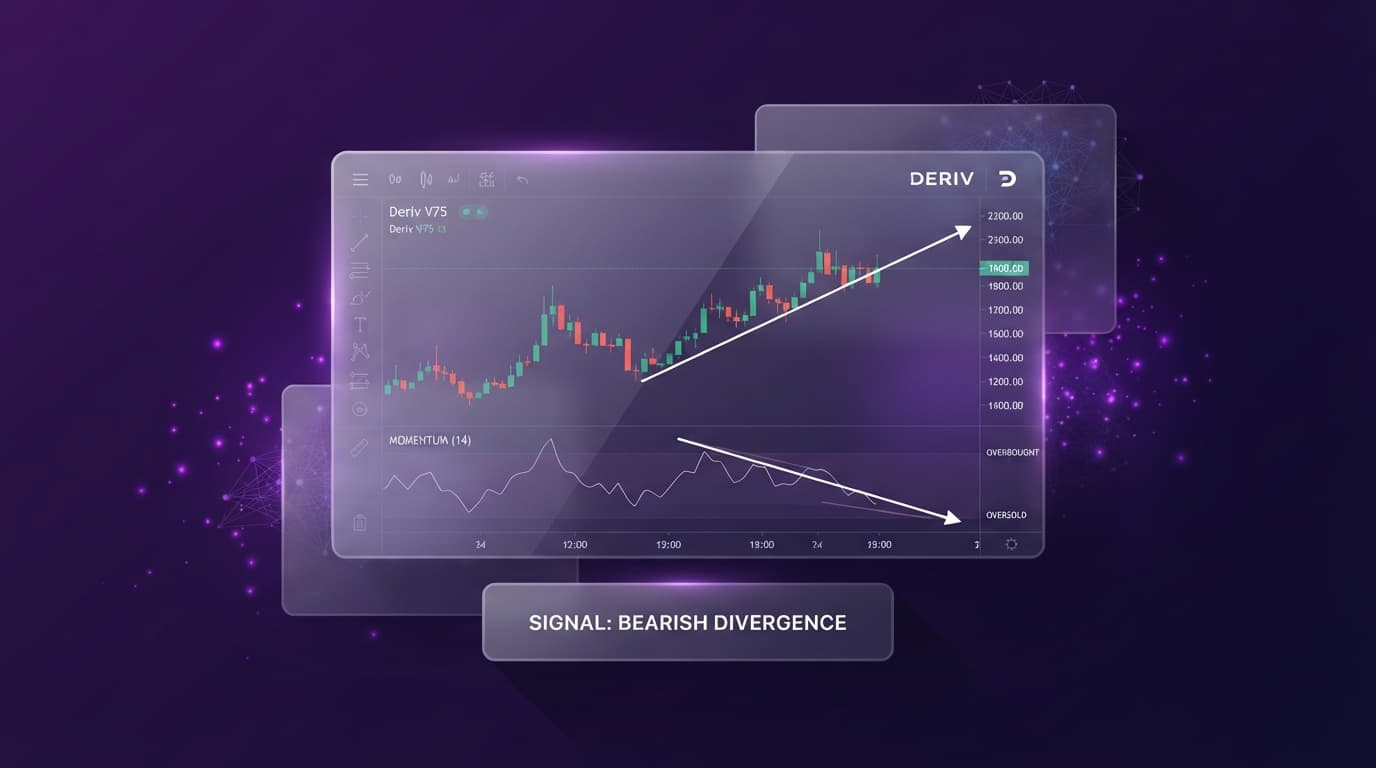
In technical analysis, Relative Strength Index (rsi divergence) on synthetic index charts occurs when price action trends in one direction while the RSI oscillator moves in the opposite direction, revealing momentum exhaustion or trend continuation before price pivots. Spotting this disparity on instruments like the Volatility 75 Index (V75) helps traders avoid chasing false breakouts. Using NexTrader Charts, you can map oscillator swings directly against raw price structure across continuous 24/7 feeds.
Synthetic index algorithms simulate real-market volatility without economic news shocks or market closes. While this creates clean technical trends on instruments like the Volatility 100 (1s) Index (V100 1Hz), it also generates aggressive liquidity sweeps. Unfiltered momentum indicators can easily trap traders into premature counter-trend positions during strong directional expansions.
Mastering high-probability setups requires combining structural peak-and-trough mapping with systematic multi-timeframe filtering. By leveraging free NexTrader Charts built specifically for synthetic feeds, you can isolate high-probability divergence signals and filter out low-quality noise.
What Is RSI Divergence and How Do Structural Swing Points Confirm It?
RSI divergence occurs when the slope of price action disagrees with the slope of the Relative Strength Index (RSI). The standard 14-period RSI measures the velocity and magnitude of recent price changes on a scale from 0 to 100. When price establishes a new extreme high or low that the 14-period RSI fails to replicate, a disparity in underlying momentum opens up.
Analyze Deriv Markets Free
Pro-grade Deriv charts with 100+ indicators — RSI, MACD, Bollinger, Ichimoku. Synthetic indices, forex & crypto.
- 100+ Indicators
- Price Alerts
- All Timeframes
- Free Forever
In synthetic index trading, divergence falls into two distinct categories:
- Regular Divergence: Indicates momentum exhaustion and signals a potential trend reversal.
- Hidden Divergence: Indicates momentum reset during a pullback and signals trend continuation.
Validating these setups requires strict rules regarding structural price peaks and troughs. Relying strictly on indicator line turns without confirming swing points on the candlestick chart creates systematic losses. To establish a legitimate signal on NexTrader Charts, the oscillator must reach extreme territory—above the 70 overbought line or below the 30 oversold line—on the initial swing peak or trough.
To eliminate subjective noise, plot explicit structural lines using the platform's deriv trading tools. Select the trendline tool in NexTrader Charts to connect two consecutive price peaks (in an uptrend) or price troughs (in a downtrend). Simultaneously, draw a matching line across the corresponding peaks or troughs on the 14-period RSI window beneath the main chart. A valid structural divergence exists only when the directional slopes of these two trendlines clearly contradict each other.
Regular vs. Hidden Divergence: Reversal vs. Trend Continuation Setups
Understanding the structural differences between regular and hidden divergence is essential for timing systematic entries on continuous market feeds.
Regular Divergence: Catching Exhaustion and Reversals
Regular divergence develops when price pushes to a fresh extreme, but the 14-period RSI produces a weaker swing. This demonstrates that while price achieved a new high or low, buying or selling volume velocity dropped significantly.
- Regular Bullish Divergence: Price creates a Lower Low (LL), but the RSI prints a Higher Low (HL) below or near the 30 oversold line. This demonstrates that sellers are losing control, setting up a potential bullish reversal.
- Regular Bearish Divergence: Price creates a Higher High (HH), but the RSI prints a Lower High (LH) above or near the 70 overbought line. This reveals fading buying pressure, signaling a potential bearish reversal.
On the Volatility 75 Index, regular bearish divergence frequently forms at key psychological resistance levels. When V75 spikes to test a prior daily high, price may wick higher into liquidity, while the RSI prints a distinctly lower peak than its previous run. Connecting these structural points on NexTrader Charts provides clear visual confirmation that buyers are exhausted.
Hidden Divergence: Trading Trend Continuation
Hidden divergence is often the higher-probability setup because it trades in the direction of the macro trend. It identifies moments where price makes a temporary structural correction, but the momentum oscillator resets aggressively, signaling that the primary trend is ready to resume.
- Hidden Bullish Divergence: Price creates a Higher Low (HL) above a key support zone, but the RSI drops to a Lower Low (LL). This shows that despite heavy indicator selling pressure, price structure held firm.
- Hidden Bearish Divergence: Price creates a Lower High (LH) below a resistance zone, but the RSI climbs to a Higher High (HH). This indicates that buyers pushed the oscillator higher, yet price failed to break structural resistance.
When trading the continuous Volatility 75 Index feed, hidden bullish divergence offers entries during steady uptrends. As price pulls back toward a horizontal support level on NexTrader Charts, the RSI may drop sharply toward oversold territory. The fact that price maintained a higher structural low while the oscillator reset completely gives traders an edge to join the prevailing upward trend.
Eliminating False Signals with Multi-Timeframe NexTrader Charts Analysis
A 1-minute regular divergence on the Volatility 100 (1s) Index will easily fail if the 1-hour macro trend is expanding aggressively against it. Higher timeframe momentum routinely steamrolls lower timeframe exhaustion signals.
By executing systematic multi-timeframe NexTrader Charts analysis, you filter out weak counter-trend traps and trade exclusively with higher-timeframe structural backing.
Multi-Timeframe Alignment Protocol
- Macro Trend Baseline (1-Hour Chart): Identify the overall market structure on NexTrader Charts. Is the 1-hour chart making clean higher highs and higher lows, or is it ranging between key horizontal levels?
- Intermediate Setup Identification (15-Minute Chart): Locate key support/resistance zones and check for structural 14-period RSI divergence. A 15-minute divergence aligned with the 1-hour trend provides the structural foundation.
- Micro Execution Trigger (1-Minute Chart): Drop down to the 1-minute chart frame to refine your entry. Look for a secondary micro-divergence or a structural break of the 1-minute counter-trend line to execute with tight stop-loss placement.
Saving configured multi-timeframe profiles directly within NexTrader Charts preserves custom technical settings during fast-moving market sessions. Using free template saving features, you can switch between 1-hour, 15-minute, and 1-minute layout views for V75 and V100 (1s) without losing drawn support/resistance lines, trendline overlays, or custom 14-period RSI parameters.
Step-by-Step RSI Divergence Execution Strategy on Synthetic Indices
Follow this mechanical execution strategy to map, validate, and trade RSI divergence setups on Volatility 100 (1s) Index and Volatility 75 Index without getting caught in false breakouts.
Step 1: Map Macro Support and Resistance
Open NexTrader Charts and select the Volatility 100 (1s) Index on the 1-hour timeframe. Use the platform's horizontal drawing tools to plot key structural support and resistance levels from recent price swing extremes.
Step 2: Identify Divergence on the 15-Minute Window
Switch to the 15-minute timeframe and attach the standard 14-period RSI from the indicator library. Watch for price testing your drawn macro levels:
- For a sell setup, verify that price hits a higher high while RSI forms a lower high above 70.
- For a buy setup, verify that price hits a lower low while RSI forms a higher low below 30.
Use the native trendline tool to draw visual confirmation lines connecting the peaks/troughs on both price and the RSI sub-panel.
Step 3: Set Price Alerts at Structural Key Levels
Set price alerts directly on NexTrader Charts at the key structural swing high or swing low trigger level. Marking these exact breakout levels allows you to track price approaching your setup threshold without jumping into trades prematurely.
Step 4: Drop to the 1-Minute Chart for Entry Validation
When price triggers your designated key level, switch to the 1-minute timeframe to confirm micro-structure. Wait for a candle to close beyond the micro counter-trendline or local market structure break before opening your position with your broker.
Step 5: Apply Strict Risk Rules and Target Locations
- Stop-Loss Placement: Place your stop-loss slightly beyond the invalidation swing peak (for short trades) or swing trough (for long trades) drawn on your chart.
- Take-Profit Target: Target the opposing 15-minute structural support or resistance level, ensuring a minimum risk-to-reward ratio of 1:2.
By combining strict peak-and-trough drawing rules with multi-timeframe alignment on free professional charts, you eliminate random entry decisions and trade synthetic index momentum with systematic confidence.
Start mapping high-probability divergence setups today on NexTrader Charts. Join our Telegram community at Telegram to share deriv chart analysis and market breakdowns with fellow traders, and get free signal updates via t.me/nextrader_signals.
Trading involves risk. Past performance does not guarantee future results.