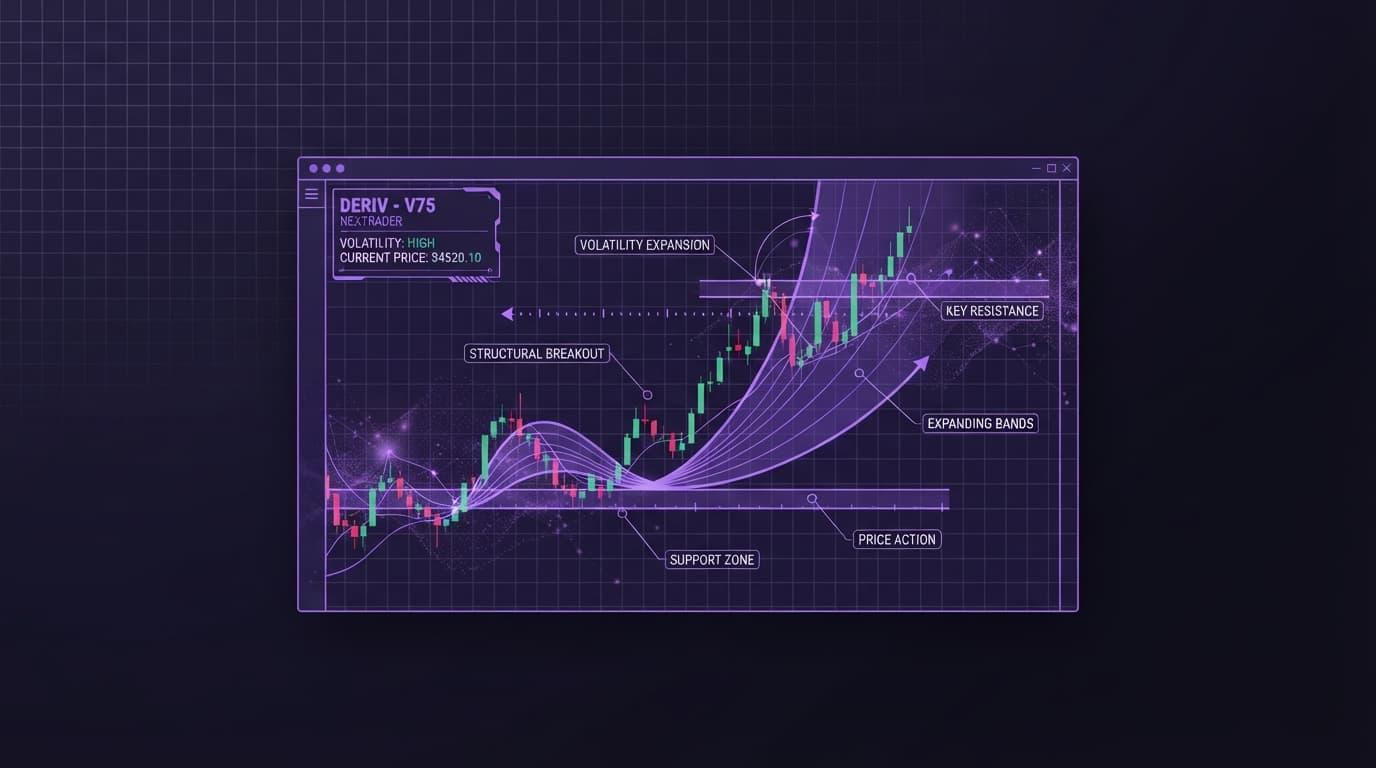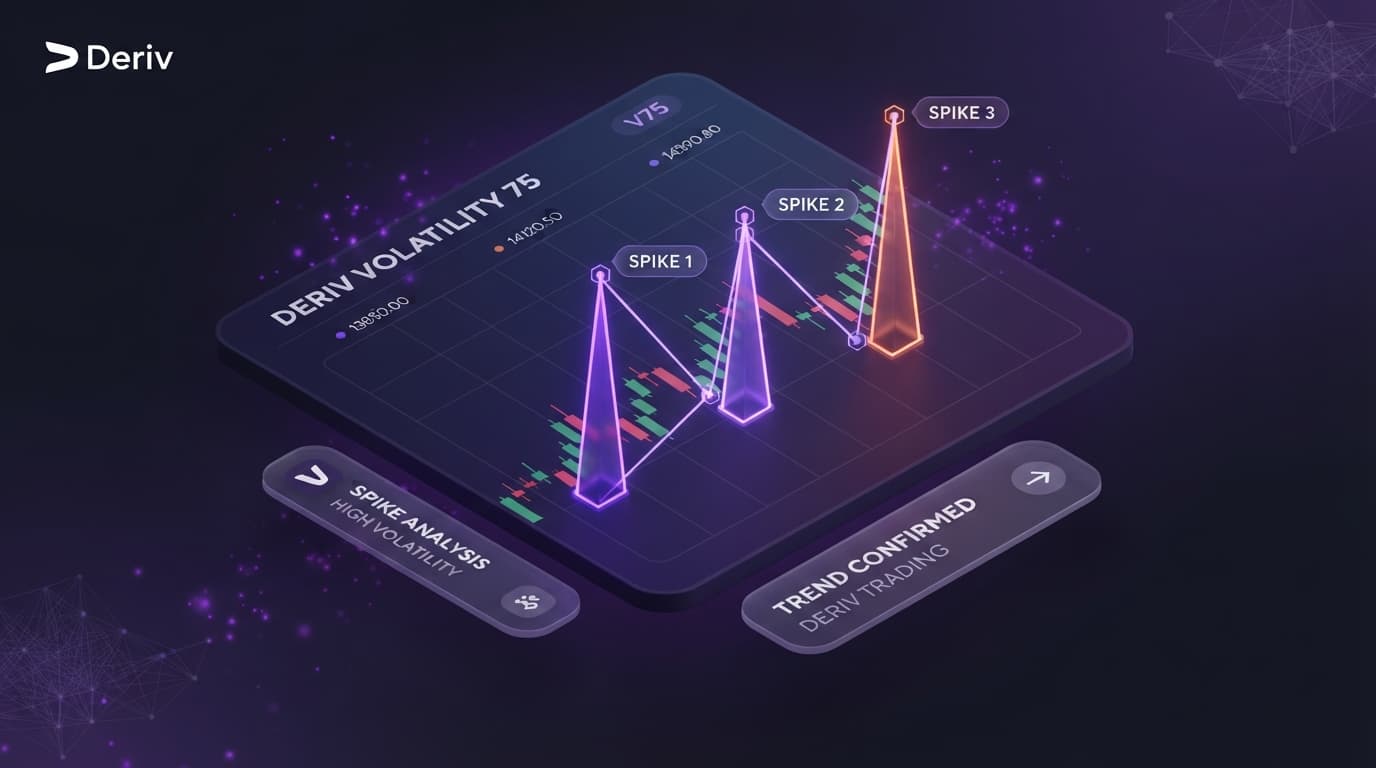
Mapping precision, 3-point validated trendlines on high-volatility wicks requires a systematic process because Deriv synthetic indices operate continuously with intense tick velocity. Instruments like the Volatility 75 Index (V75), Volatility 100 (1s) Index, and Boom 1000 frequently print rapid wick spikes that make manual drawing imprecise.
By using free charting tools built specifically for synthetic and forex traders on NexTrader Charts, you can lock trendlines directly onto exact extreme prices. This practical tutorial covers every step to build clean, objective chart analysis setups on NexTrader Charts.
- 1 Launch NexTrader Charts & Pick Volatility or Forex Instrument
- 2 Enable Strong Magnet Mode for Instant Wick Snapping
- 3 Draw Line Across 3 Distinct Anchor Points for Validation
- 4 Set Breakout Price Alerts & Save Custom Layout
What You Need
Before setting up your workspace, ensure you have the following prerequisites ready:
- A free NexTrader Charts session open in your browser at NexTrader Charts
- A free Deriv trading account (used to supply real-time market data connectivity via WebSocket API)
- A target market selected for analysis, such as the Volatility 75 Index (V75), Volatility 100 (1s) Index, Boom 1000, or EUR/USD forex pair
Step 1: Open NexTrader Charts for Deriv Chart Analysis
Navigate to NexTrader Charts to open your charting workstation.
Analyze Deriv Markets Free
Pro-grade Deriv charts with 100+ indicators — RSI, MACD, Bollinger, Ichimoku. Synthetic indices, forex & crypto.
- 100+ Indicators
- Price Alerts
- All Timeframes
- Free Forever
Locate the instrument selector in the top-left corner of the header bar. Click the asset dropdown menu and navigate through the category tree or use the instant search bar. For synthetic indices, expand the Synthetic Indices category and select Volatility 75 Index or Volatility 100 (1s) Index. If you trade crash or boom markets, select Boom 1000 Index. For currency markets, search for major FX pairs like EUR/USD.
Once your target asset loads, adjust your chart timeframe using the timeframe selection bar located right next to the symbol name. Start on a higher timeframe, such as the 1-hour (1h) or 15-minute (15m) chart, to map out the overarching macro structure. Starting on macro timeframes filters out lower-timeframe noise and reveals distinct swing highs and swing lows where major market liquidity resides.
Step 2: Enable Magnet Mode for Precise Wick Snapping
Synthetic indices run on algorithmic generators that update every second or tick, producing sharp price extremes. Drawing lines manually on these candles creates rounding errors, especially when zooming in on lower execution timeframes like 5-minute or 1-minute charts.
To eliminate manual error, head to the vertical Drawing Toolbar positioned on the far-left side of the NexTrader Charts interface. Look for the magnet icon located near the bottom half of the toolbar. Click the icon to expand the Magnet Mode toggle options: Strong Magnet and Weak Magnet.
Select Strong Magnet. When Strong Magnet mode is active, your cursor acts as a snap-to tool. As you hover near any candlestick, the cursor automatically attaches itself to the exact open, high, low, or close price of that candle. For trendline drawing on high-volatility synthetic indices, this ensures your anchor points lock directly onto the highest upper wick point or lowest lower wick point with zero manual alignment offset.
Step 3: Select the Trend Line Tool and Set Anchor 1 and Anchor 2
With Strong Magnet enabled, select the Trend Line tool from the top section of the left drawing toolbar. Alternatively, press the keyboard shortcut Alt + T to activate the tool instantly.
Identify the start of the current market structure. For an ascending trendline (dynamic support in an uptrend), find the major swing low that started the upward push. Position your crosshair near the lowest tip of that candle's wick. Strong Magnet will immediately lock onto the exact low price. Click once to place Anchor 1.
Next, move your cursor across the chart toward the next prominent structural swing low that formed after a higher high. As your cursor approaches the wick extreme of that second swing point, Strong Magnet will pull the point onto the wick tip. Click a second time to lock in Anchor 2.
For a descending trendline (dynamic resistance in a downtrend), follow the exact reverse logic: connect the highest wick of the initial swing high (Anchor 1) to the highest wick of the subsequent lower high (Anchor 2).
Step 4: How to Draw Trendlines on Deriv Charts with 3-Point Anchor Confirmation
Drawing a line across two points creates a mathematical ray, but in professional technical analysis, two points only represent a speculative slope. To turn a draft line into a validated support or resistance boundary, you must verify a third structural touch point.
Extend your trendline forward through future price bars. Watch how price interacts with the extended line on historical bars or current price action. You need to see at least three distinct candle wick touches respecting the exact line trajectory (Anchor 3 Validation).
Follow these essential confirmation rules when evaluating trendlines on Deriv markets:
- Three-Point Touch Rule: Never base execution decisions on a line with only two anchor touches. Anchor 1 establishes the origin, Anchor 2 establishes the angle, and Anchor 3 validates structural strength.
- Wick-to-Wick Consistency: Maintain absolute consistency across your anchors. If Anchor 1 and Anchor 2 snap to upper wicks, Anchor 3 must also interact with upper wicks. Do not mix wick highs with candle bodies on synthetic charts.
- No Structural Piercing: If candles close significantly past the trendline between your anchors, the level is invalidated. Minor wick overshoots during high-volatility spikes on V75 or V100 (1s) can occur, but full candlestick body closures beyond the line signal a structural breach.
Step 5: Configure Chart Price Alerts for Breakout Detection
Once you have established a 3-point validated trendline across 24/7 synthetic indices or forex assets, monitoring the chart constantly is impractical. NexTrader Charts provides real-time server-side price alerts directly tied to your drawn objects.
Right-click the active trendline on your workspace, or select the bell icon on the line's action bar, then choose Add Alert on Trend Line.
In the price alert configuration dialog, configure your trigger parameters based on your trade setup:
- Condition: Select how price must interact with your line, such as Crossing, Crossing Up, or Crossing Down. For a descending dynamic resistance line, select Crossing Up to trigger when price breaks above resistance.
- Trigger Frequency: Choose Once Per Bar Close to confirm a full candlestick close past the trendline, or Only Once for an immediate breakout alert upon the first price touch.
- Alert Name & Message: Name your alert (for example, "V75 Resistance Breakout") so you immediately recognize the setup when notified.
Save the alert settings. NexTrader Charts will track incoming tick updates via the WebSocket feed and issue notifications as soon as price breaches your trendline.
Step 6: Save Your Chart Template and Sync with Execution Strategies
After establishing precise trendlines across multiple timeframes, preserve your workspace layout. Click the Manage Templates (cloud/disk) icon located in the top bar of NexTrader Charts. Click Save Chart Layout and assign a recognizable name such as "Deriv Precision Trendlines".
Saving your template stores all drawing tools, active indicators, customized colors, and timeframe layouts under your session. This enables you to reload your complete technical environment across different devices without losing your mapped support and resistance zones.
If Something Goes Wrong
If you encounter unexpected behavior while drawing or saving trendlines on NexTrader Charts, check these quick troubleshooting resolutions:
- Magnet Mode is snapping to candle bodies instead of wicks: Open the left drawing toolbar, click the Magnet icon, and ensure Strong Magnet is selected rather than Weak Magnet. Additionally, confirm that your chart style is set to Candlesticks or Bars rather than Line or Heikin-Ashi, as line charts do not display high/low wick extremes.
- Price alert is triggering too frequently on minor noise: Synthetic indices like Volatility 75 or Volatility 100 (1s) can generate brief tick spikes. If lower timeframe alerts trigger false alarms, zoom out to the 15m or 1h timeframe, re-anchor your trendlines on higher-timeframe swing wicks, and recreate your alert with the Once Per Bar Close condition enabled.
- Trendlines disappear after refreshing your browser: Drawings only persist if saved to your chart layout session. Always click Save Chart Layout in the top header menu before closing your browser tab or clearing browser cache.
By combining Strong Magnet precision snapping, 3-point wick validation, integrated price alerts, and custom layout saving on NexTrader Charts, you gain a professional edge across synthetic and currency markets.
Ready to map precision trendlines on live Deriv markets? Head over to NexTrader Charts to access 100% free professional charts, or create your account on the NexTrader Ecosystem and join our active trading community on Telegram.
Trading involves risk. Past performance does not guarantee future results.