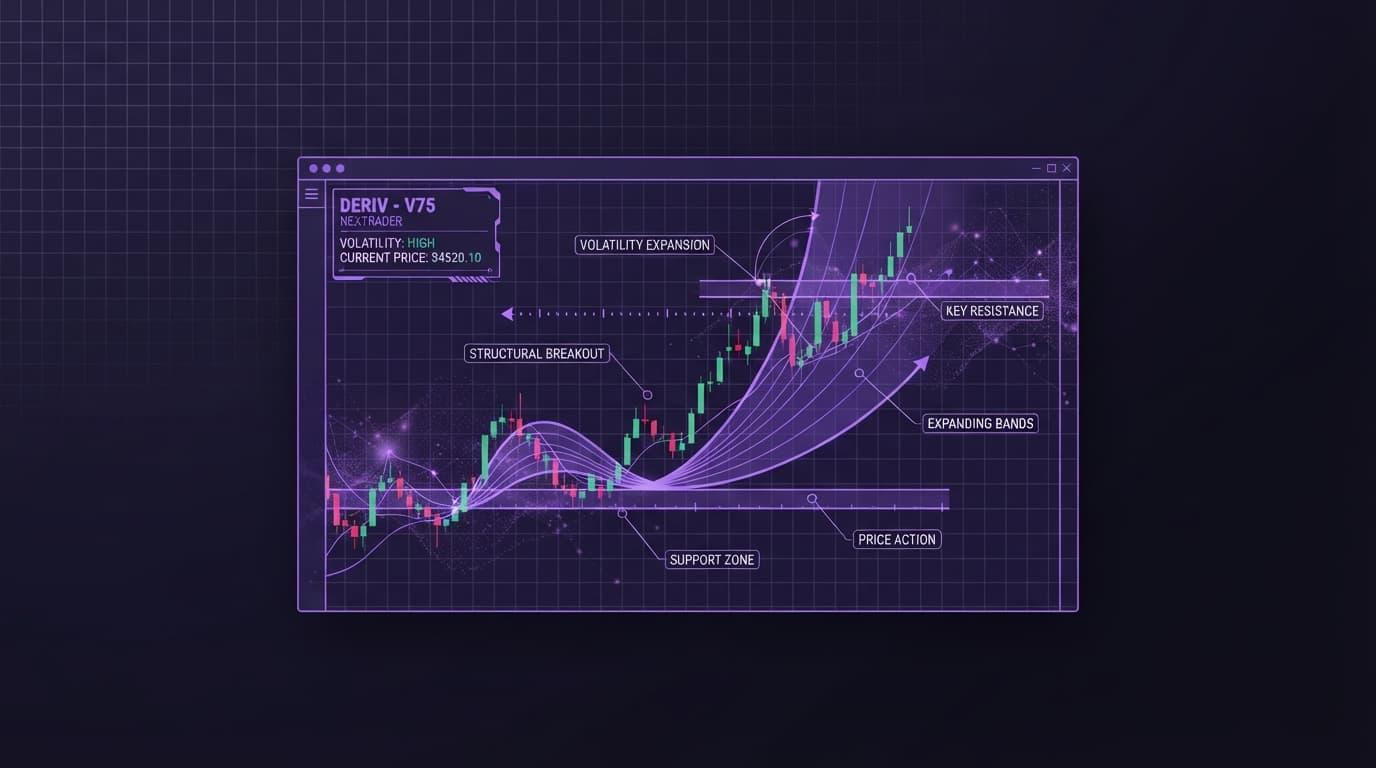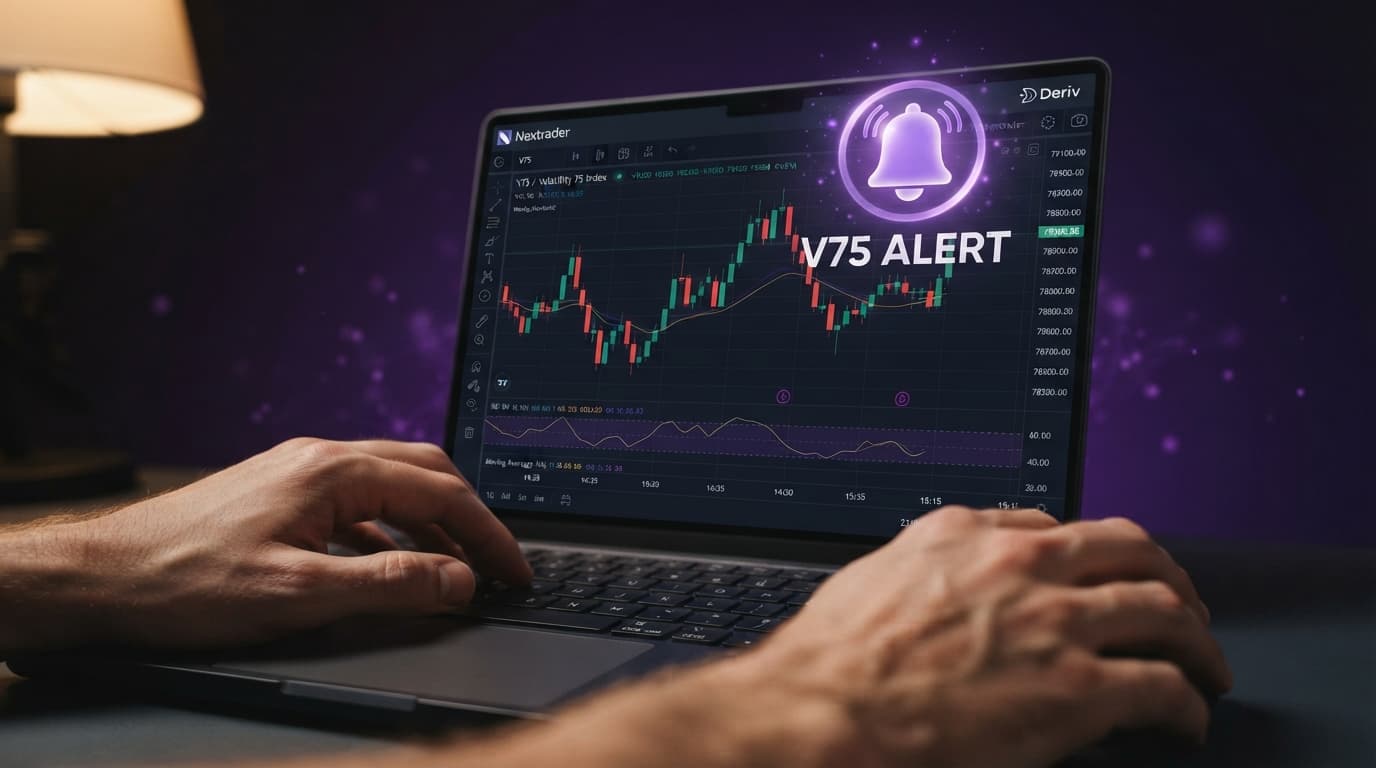
Setting up custom price alerts on NexTrader Charts gives you instant notifications when key synthetic index levels break, without requiring you to sit glued to your screen. Built on high-speed WebSocket connections direct to Deriv market feeds, our web platform delivers instant audio and visual triggers the moment price touches your exact level.
By completing a proper deriv price alerts setup, you can track fast-moving assets like Volatility 75 Index (V75) or Volatility 100 (1Hz) Index without screen fatigue. Notifications sound instantly across your browser, letting you maintain disciplined execution during active trading sessions.
Step 1: Launch NexTrader Charts and Select Your Synthetic Index
Open NexTrader Charts in your web browser. The workspace loads real-time market data immediately through a direct WebSocket connection with zero subscriptions or paywalls.
Click on the asset selector dropdown in the top-left corner of the charting toolbar. Select your target instrument from the synthetic indices list, such as Volatility 75 Index or Volatility 100 (1Hz) Index.
Analyze Deriv Markets Free
Pro-grade Deriv charts with 100+ indicators — RSI, MACD, Bollinger, Ichimoku. Synthetic indices, forex & crypto.
- 100+ Indicators
- Price Alerts
- All Timeframes
- Free Forever
Next, set your operational timeframe using the top navigation bar. Options range from 1-minute to monthly candles, allowing you to conduct fast deriv chart analysis on your preferred chart view without losing your drawing overlays or technical indicators.
Step 2: Map Key Price Levels Using Drawing Tools
Before attaching a notification trigger, place horizontal lines or trendlines at your target price levels. Locate the vertical toolbar on the left side of the chart interface.
Click Drawing Tools and choose Horizontal Line or Trendline:
- Click directly on the chart canvas to place a horizontal line at a specific price coordinate.
- Use the line menu to adjust color, style, and line weight for clear visual distinction on your chart.
- Add technical indicators via the Indicators menu at the top toolbar (including RSI, MACD, or Bollinger Bands) to confirm key levels before placing your line.
Utilizing these deriv trading tools allows you to bind precise automated alerts directly to drawn support and resistance levels.
Step 3: Open the Price Alert Configuration Window
Once your target levels are plotted on NexTrader Charts, open the alert setup dialogue using one of two methods:
- Line Binding: Right-click directly on any active horizontal line or drawing element on your chart and select Add Alert. This locks the alert target to that exact drawing line.
- Canvas Placement: Right-click anywhere on the chart canvas at your desired target price and select Add Alert at [Price].
The alert configuration dialogue window will immediately open over your workspace.
Step 4: Define Trigger Conditions and Expiry Settings
In the alert configuration window, configure the specific parameters for your notification:
- Condition: Select your trigger rule from the dropdown menu:
- Crossing: Triggers when price crosses the line in either direction.
- Crossing Up: Triggers when price moves above the line from below.
- Crossing Down: Triggers when price moves below the line from above.
- Target Value: Fine-tune the target price field to match your exact tick coordinate.
- Trigger Frequency:
- Select Only Once to deactivate the alert after its initial trigger.
- Select Every Time to keep the alert active for recurring bounces within a price channel.
- Expiration Time: Specify a date and time for the alert to auto-expire, keeping your active alert queue clean.
Step 5: Enable Audio, Browser, and Visual Alerts
Enable all three notification channels built into NexTrader Charts to make sure you never miss a trigger:
- Audio Chimes (Play Sound): Toggle Play Sound to ON and select an alert sound from the dropdown menu to hear an immediate sound effect when your price level is hit.
- Desktop & Browser Push Notifications (Send Notification / Pop-up): Toggle Send Notification / Pop-up to ON. The browser sends a system push banner displaying the symbol, exact time, and trigger price, even if the charting tab is running in the background.
- Visual Markers (Show Bar / Line Marker): Enable Show Bar / Line Marker to display a visual icon directly on the candle tick that triggered the condition.
Step 6: Test Notification Triggers and Save Your Chart Template
Verify your alert configuration before relying on it during active market sessions:
- Place a temporary horizontal line 1 or 2 ticks away from the current live price on a fast-moving chart like Volatility 100 (1Hz).
- Right-click the line, set an alert to Crossing, and save it.
- Confirm that the audio tone rings, the pop-up notification fires, and the chart highlights the visual marker when price crosses the level.
- Delete the temporary test line.
After testing, click Chart Templates on the top toolbar and choose Save Layout. Saving your layout keeps your support/resistance levels, visual preferences, and active price alerts stored safely in your browser for future sessions. You can also export high-resolution chart images with the built-in screenshot tool to track your setups or share analysis with fellow traders in our Telegram.
If Something Goes Wrong
If your alerts do not trigger as expected, check these common browser settings:
- No sound plays on alert: Web browsers block auto-play audio by default. Click the lock icon in your address bar next to NexTrader Charts, open Site Settings, and set Sound and Auto-play permissions to "Allow".
- Browser notifications fail to appear: Ensure desktop notification permissions are enabled for your browser in your operating system settings. Turn off "Do Not Disturb" or "Focus Assist" modes, which hide push banners.
- Alert line disappeared: Check whether the set expiration time has passed. Expired alerts automatically clear from the active queue. Reload your saved chart workspace via the Chart Templates menu.
Analyze Deriv synthetic indices with high-performance tools and zero subscription fees. Start charting real-time volatility markets on NexTrader Charts today and join active traders in our official Telegram.
Trading involves risk. Past performance does not guarantee future results.