Exponential moving averages (EMAs) apply a weighting multiplier—$2 / (N + 1)$—that gives exponentially more weight to recent price data over time, making them far more responsive than simple moving averages. Deploying a structured ema crossover strategy on fast-moving assets like Deriv synthetic indices requires strict volatility filters and precise risk parameters. Without these guardrails, moving average strategies trigger endless false signals during tight consolidation periods.
By combining short-term and medium-term EMAs with the Average True Range (ATR) on NexTrader Charts (NexTrader Charts), you can isolate high-probability entries, eliminate low-volatility noise, and automate your workflow with price alerts.
The Checklist
- Select a high-volatility market (e.g., Volatility 75 Index or EUR/USD) on NexTrader Charts.
- Apply the 9 EMA (Fast) and 21 EMA (Slow) indicators to your 5-minute or 15-minute chart.
- Add the 14-period ATR indicator to screen out low-volatility zones.
- Wait for a clear 9/21 EMA crossover accompanied by an expanding ATR value above its recent range baseline.
- Calculate your entry price, $1.5 \times \text{ATR}$ dynamic stop-loss, and $3.0 \times \text{ATR}$ take-profit target.
- Set real-time price alerts on NexTrader Charts and save your customized workspace template.
- 1 Map 9 EMA and 21 EMA on 5m or 15m timeframes
- 2 Confirm ATR expansion above recent consolidation baseline
- 3 Execute trade with 1.5x ATR stop-loss and 3.0x ATR profit target
NexTrader Chart Analysis and Execution Steps
1. Launch NexTrader Charts and Select Your Instrument
Open NexTrader Charts (NexTrader Charts) to access real-time deriv charts for synthetic indices, forex pairs, commodities, and cryptocurrencies. Choose your target market based on your active trading hours.
Synthetic markets like the Volatility 75 Index (V75) and Volatility 100 Index (V100) run 24/7 on cryptographic algorithms, generating constant order flow without weekend gaps. If you prefer traditional assets, major forex pairs such as EUR/USD and GBP/USD offer deep liquidity during London and New York overlaps. Switch your chart timeframe to either the 5-minute or 15-minute interval. These timeframes strike the optimal balance between trend longevity and low execution latency for intraday traders.
Analyze Deriv Markets Free
Pro-grade Deriv charts with 100+ indicators — RSI, MACD, Bollinger, Ichimoku. Synthetic indices, forex & crypto.
- 100+ Indicators
- Price Alerts
- All Timeframes
- Free Forever
2. Configure the 9 EMA and 21 EMA Indicators
Navigate to the indicator library on NexTrader Charts and load two instances of the Moving Average Exponential indicator. The fast line uses a 9-period setting, while the slow line uses a 21-period setting. Both must be calculated using the Close price.
Fast EMA = 9 periods (Close)
Slow EMA = 21 periods (Close)
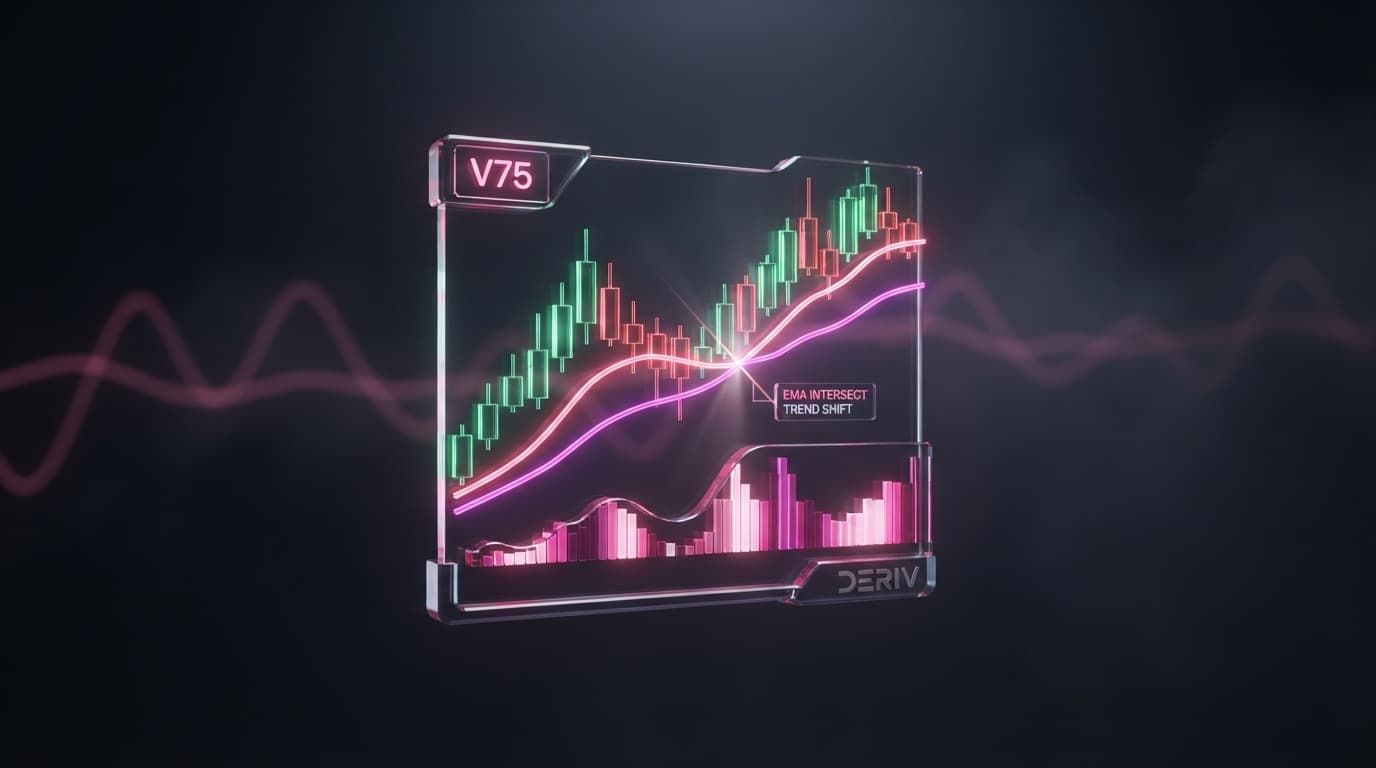
When the 9 EMA crosses above the 21 EMA, short-term buyer momentum dominates; a cross below indicates accelerating downside momentum. Stacking these two inputs side-by-side on NexTrader Charts provides instant visual confirmation of directional shifts.
3. Add the 14-Period ATR Indicator for Volatility Filtering
Load the 14-period Average True Range (ATR) indicator from the indicator panel. The ATR measures market volatility by calculating the absolute true range across 14 candles.
Use standalone ATR values to establish an objective volatility threshold before entering trades:
- Filter Active (Trade Allowed): The 14-period ATR value is actively rising above its recent consolidation baseline (for example, breaking above recent trough levels on the ATR sub-pane). This signals volatility expansion, confirming the move has sufficient momentum to sustain a multi-candle trend.
- Filter Inactive (No Trade): The 14-period ATR value remains flat or declines below its baseline level. This indicates a low-volatility squeeze, where moving average crossovers trigger frequent false signals.
Performing rigorous technical analysis with this volatility filter on NexTrader Charts prevents you from entering positions during flat market cycles.
4. Mastering the EMA Crossover Strategy on Synthetic Indices
A complete entry setup requires alignment between moving average direction and volatility expansion. Do not enter on the exact touch of the two EMAs; wait for the signal candle to close completely to prevent false breakouts.
#### Bullish Setup Rules:
- The fast 9 EMA crosses above the slow 21 EMA on the 5-minute or 15-minute timeframe.
- The signal candle closes firmly above both moving averages.
- The 14-period ATR value expands clearly above its recent range baseline.
- Open a buy order at the market open of the next candle.
#### Bearish Setup Rules:
- The fast 9 EMA crosses below the slow 21 EMA on the 5-minute or 15-minute timeframe.
- The signal candle closes firmly below both moving averages.
- The 14-period ATR value expands clearly above its recent range baseline.
- Open a sell order at the market open of the next candle.
You can enhance entry precision by using drawing tools on NexTrader Charts to trace immediate support and resistance levels. If a bullish crossover occurs right below a major resistance level, wait for a breakout before committing capital.
5. Calculate Dynamic Stop-Loss and Take-Profit Levels Using ATR
Fixed pip or dollar stop-losses fail on synthetic indices because asset volatility fluctuates continuously. A 20-point stop on V75 might be excessive during quiet hours, yet get stopped out in seconds during high-volatility moves.
Calculate dynamic stop-loss and take-profit thresholds using the signal candle's ATR value:
$$\text{Initial Stop-Loss Distance} = 1.5 \times \text{ATR}(14)$$
$$\text{Take-Profit Target Distance} = 3.0 \times \text{ATR}(14)$$
For a long trade entered at 500.00 on a synthetic index with an ATR reading of 4.0:
- Stop-Loss: $500.00 - (1.5 \times 4.0) = 494.00$
- Take-Profit: $500.00 + (3.0 \times 4.0) = 512.00$
This configuration maintains a strict 1:2 Risk-to-Reward ratio. As the trade moves in your favor, trail your dynamic stop-loss level behind the slow 21 EMA. If price closes on the opposite side of the 21 EMA before hitting your main take-profit target, close the position manually to lock in gains.
6. Set Real-Time Price Alerts and Save Your Chart Template
You do not need to monitor price action continuously to catch setups. Configure real-time alerts directly on NexTrader Charts:
- Click the Alert button on the top toolbar or select the alert icon on the price scale.
- Select your target instrument and define the price condition or crossing parameters for the 9 EMA and 21 EMA.
- Enable pop-up or sound notifications to receive instant alerts when a crossover occurs.
Once your 9 EMA, 21 EMA, and ATR setup are applied, click the layout menu on the top toolbar and select Save Template. Name it 9/21 EMA Volatility Strategy. You can now apply this layout instantly across V10, V25, V50, V75, V100, forex, gold, silver, and crypto without rebuilding your workspace.
Common Mistakes
1. Taking Every Crossover During Low-Volatility Squeezes
The Mistake: Executing every 9/21 EMA signal, even when candles are small and moving sideways in a tight range.
The Correction: Always cross-reference the 14-period ATR. If the ATR line is flat or below its recent baseline level, ignore all crossover signals until volatility expands.
2. Relying on Fixed Pip Stops on Volatile Synthetic Indices
The Mistake: Placing a standard 10-pip or $5 stop-loss across all indices without accounting for market dynamics.
The Correction: Synthetics like V75 and V100 experience rapid price shifts. Always multiply the current ATR by $1.5$ to set a mathematically sound stop-loss tailored to current conditions.
3. Exiting Positions Early at the First Pullback Candle
The Mistake: Panicking and closing a profitable trade at the first counter-trend candle before price hits your target.
The Correction: Trust your fixed 1:2 Risk-to-Reward plan ($3.0 \times \text{ATR}$). Let the price run to your target, or rely on a trailing stop anchored to the 21 EMA on NexTrader Charts to handle trade exits objectively.
Start Now
A successful ema crossover strategy requires standard technical indicators combined with real-time volatility filtering. By anchoring the 9 EMA and 21 EMA to an ATR expansion filter, you avoid chop and enter trends when market momentum is highest.
Launch your analysis setup instantly on NexTrader Charts—our free suite of charting tools built for Deriv traders:
- Open the web charts platform: NexTrader Charts
- Sign up for a free Nextrader account: Sign Up Free — Nextrader
- Join our community for live updates and strategy discussions: Telegram
Trading involves risk. Past performance does not guarantee future results.