Filtering price action with a 50-period Exponential Moving Average (EMA), a mandatory 60% body-to-wick ratio, and a 1.5x Average True Range (ATR) stop loss on NexTrader Charts provides a disciplined, rule-based engulfing candle strategy that eliminates false breakouts across 24/7 Deriv synthetic indices and forex markets.
Most retail traders fail when trading engulfing patterns because they treat every two-bar reversal as an automatic trade signal. On high-volatility instruments like Volatility 75 (V75) or Volatility 100 (1Hz), continuous tick generation creates constant noise. Subjective "eyeballing" leads directly to jumping into low-volume indecision candles or fighting powerful higher-timeframe trends.
Mechanical Rules for Deriv Chart Analysis: 50 EMA Filter, Body Ratio, and ATR Placement
Mechanical trading relies on binary execution rules: a setup either meets every quantitative criterion or it is ignored. When conducting deriv chart analysis on synthetic indices and forex pairs, three non-negotiable variables dictate whether an engulfing pattern is valid.
- 1 Filter trend bias using the 50 EMA on the M15 or H1 timeframe
- 2 Validate candle momentum with a minimum 60% body-to-wick ratio
- 3 Calculate dynamic risk buffer using 1.5x 14-period ATR
- 4 Set custom price alerts on NexTrader Charts for execution
1. Trend Alignment via the 50 EMA Baseline
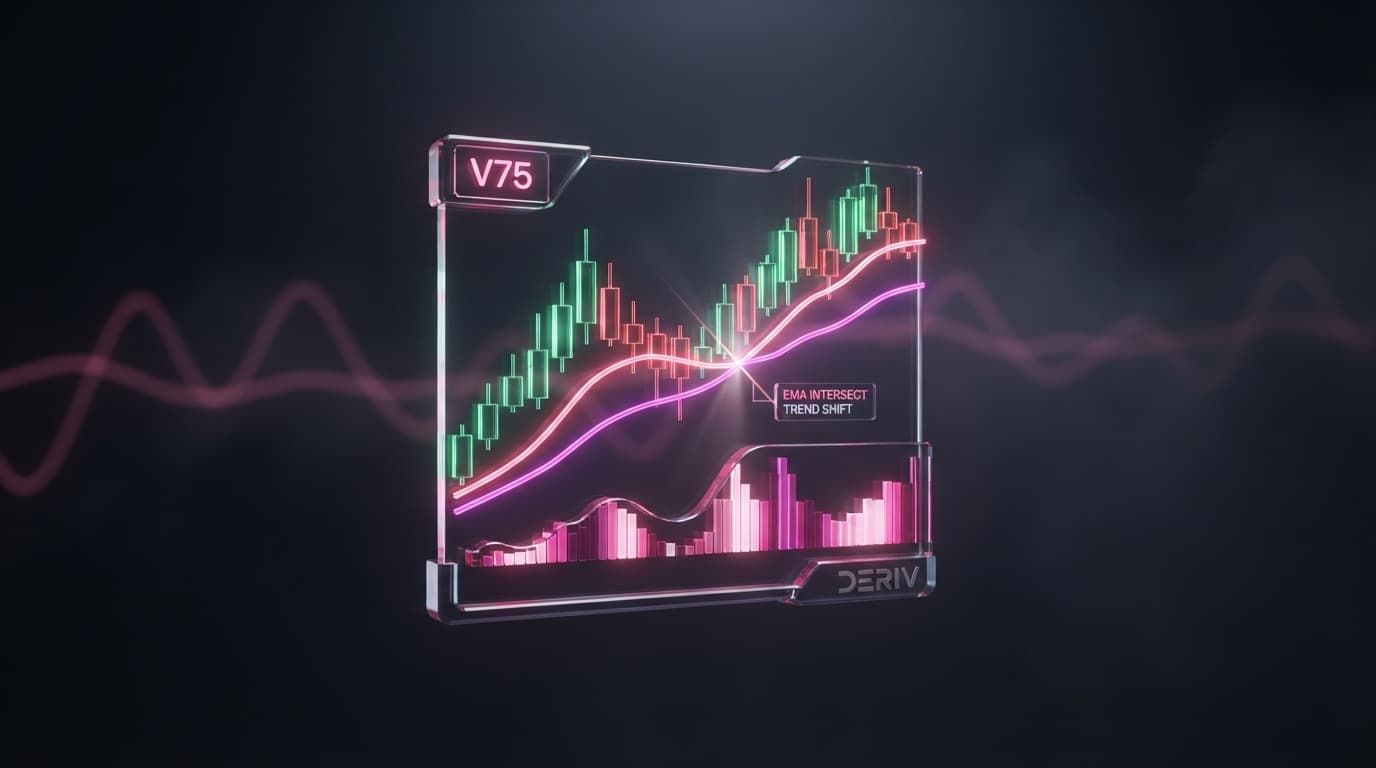
Trading against prevailing momentum on continuous synthetic indices is one of the fastest ways to destroy a trading account. The 50-period Exponential Moving Average (50 EMA) serves as your directional baseline on M15 and H1 timeframes.
Analyze Deriv Markets Free
Pro-grade Deriv charts with 100+ indicators — RSI, MACD, Bollinger, Ichimoku. Synthetic indices, forex & crypto.
- 100+ Indicators
- Price Alerts
- All Timeframes
- Free Forever
- Long Signals: Valid only when the signal candle and engulfing candle form entirely above the 50 EMA line.
- Short Signals: Valid only when the signal candle and engulfing candle form entirely below the 50 EMA line.
If an engulfing candle overlaps or touches the 50 EMA, treat the market as consolidating and discard the setup. The moving average acts as a dynamic filter, keeping you on the side of structural trend flow.
2. The 60% Body-to-Wick Verification Rule
Standard definitions state that an engulfing candle's body must fully cover the body of the preceding candle. However, on volatile synthetic indices like V25, V50, or V100, long wicks frequently disguise underlying exhaustion as momentum.
To confirm genuine institutional market participation, the engulfing candle must pass a strict mathematical calculation:
$$\text{Body Ratio} = \left( \frac{|\text{Close} - \text{Open}|}{\text{High} - \text{Low}} \right) \times 100 \ge 60\%$$
If a bullish engulfing candle has a total range (High minus Low) of 100 index points, the body (Close minus Open) must measure at least 60 points. Any candle where wicks consume more than 40% of the total range represents rejection or indecision, making it unfit for trade entry.
3. Dynamic Stop Loss Placement via 1.5x ATR
Fixed pip or point stop losses fail across Deriv synthetic indices because each index operates on distinct volatility coefficients. A 20-point stop loss on Volatility 10 Index (V10) represents a wide swing, whereas that same 20 points on Volatility 75 (V75) will be wiped out in a single tick.
To compensate for changing volatility conditions, load the 14-period Average True Range (ATR) indicator on NexTrader Charts and apply a 1.5x multiplier to its current value.
- Bullish Engulfing Stop Loss: $\text{Swing Low} - (1.5 \times \text{ATR}_{14})$
- Bearish Engulfing Stop Loss: $\text{Swing High} + (1.5 \times \text{ATR}_{14})$
This dynamic buffer prevents market noise from stopping out your position prematurely while maintaining a mathematically sound exit strategy.
Executing and Monitoring the Setup with Deriv Trading Tools on NexTrader Charts
Executing this systematic framework requires clean data feeds and low-latency workspace management. NexTrader Charts provides direct WebSocket connections to Deriv markets, allowing you to monitor synthetic indices (V10, V25, V50, V75, V100, including 1Hz series), forex, gold, and crypto in real time without subscription delays.
By using these integrated deriv trading tools on NexTrader Charts, you maintain complete visibility over trend, volatility, and momentum within a single screen.
- 1 Filter trend bias using 50 EMA on NexTrader Charts M15 workspace
- 2 Verify 60% body-to-wick engulfing ratio on closed candle
- 3 Apply 1.5x ATR dynamic stop loss and execute via Deriv broker
Price Alert Configuration & Execution
When a custom price alert triggers at key support or resistance on NexTrader Charts, verify the closing candle against system criteria at the alert trigger point:
- Confirm that the signal and engulfing candles closed entirely clear of the 50 EMA (above for long, below for short).
- Measure the closing candle range to ensure the body constitutes at least 60% of the total length.
- Calculate the 1.5x ATR offset from the swing high or low before executing through your Deriv broker account.
Fixed Risk-to-Reward Trade Management
To ensure positive statistical expectancy, enforce a minimum 1:2 Risk-to-Reward (R:R) ratio on every signal.
If your 1.5x ATR calculation results in a 40-point stop loss on Volatility 50, your minimum profit target must be set at 80 points from your entry point. Never manually adjust or shrink your ATR stop loss to artificially inflate your R:R ratio—let the mathematical framework govern your trade parameters.
Discretionary vs. Mechanical Engulfing Candle Strategy Comparison
| Strategy Metric | Discretionary Engulfing Pattern | Mechanical Engulfing Strategy (NexTrader Charts) |
|---|---|---|
| Trend Confirmation | Unfiltered / Visual intuition | Strict 50 EMA position (Above = Long, Below = Short) |
| Candle Validation | Fits visually over previous candle | Minimum 60% Body-to-Wick ratio requirement |
| Stop Loss Location | Arbitrary placement beyond wick | Dynamic (1.5 $\times$ 14-period ATR) calculation |
| Execution Platform | Standard manual charting | NexTrader Charts with custom alerts |
| Market Suitability | Standard forex hours only | 24/7 Synthetic Indices (V10–V100) and Forex |
| Emotion Factor | High (Fear of missing out, early exits) | Zero (Rules-based systematic validation) |
Step-by-Step Setup Walkthrough on Volatility 75 (V75)
To understand how this system performs live, let us review a long trade example on the M15 timeframe of the Volatility 75 Index using NexTrader Charts.
Step 1: Confirm Trend Alignment
Price pulls back toward a previous resistance-turned-support level on the M15 timeframe. Looking at the indicator pane on NexTrader Charts, the 50 EMA is sloping upward, and price action is trading entirely above the moving average line. Trend criteria: PASSED.
Step 2: Measure Candle Ratio
A bullish candle forms, swallowing the entire body of the previous bearish candle.
- Candle High: 450,200
- Candle Low: 449,200 (Total Range = 1,000 points)
- Candle Open: 449,300
- Candle Close: 450,100 (Body Range = 800 points)
$$\text{Body Ratio} = \left(\frac{800}{1000}\right) \times 100 = 80\%$$
Since 80% exceeds our mandatory 60% threshold, momentum criteria: PASSED.
Step 3: Calculate ATR Stop Loss & Take Profit
The 14-period ATR indicator on NexTrader Charts reads 400 points at the time of candle close.
- $\text{Stop Loss Distance} = 1.5 \times 400 = 600 \text{ points}$
- $\text{Stop Loss Level} = 449,200 (\text{Swing Low}) - 600 = 448,600$
- $\text{Take Profit Distance} = 600 \text{ points} \times 2 = 1,200 \text{ points}$
- $\text{Take Profit Level} = 450,100 (\text{Entry Close}) + 1,200 = 451,300$
With all three conditions confirmed, the trade is executed with predefined, mechanical risk parameters.
Master Synthetic Index Volatility with Free Professional Tools
The Nextrader ecosystem gives you everything you need to implement this mechanical engulfing framework efficiently across 24/7 synthetic indices, forex, commodities, and cryptocurrencies on NexTrader Charts.
- Professional Charting: Analyze 100+ technical indicators, apply dynamic drawing tools, and set price alerts on NexTrader Charts.
- Create Your Free Account: Get started by signing up at NexTrader App to access our suite of tools.
- Join the Community: Connect with active traders, share chart templates, and access updates in our official Telegram.
Trading involves risk. Past performance does not guarantee future results.