Finding the right stochastic rsi settings deriv traders need for fast-moving synthetic indices is often the difference between consistent execution and constant whipsaws. When you trade the Volatility 50 (1s) Index on a 1-minute timeframe, standard momentum inputs fail because 1-second tick generation floods your screen with micro-noise.
Synthetic indices operate on continuous mathematical algorithms that generate a new tick every single second, 24 hours a day, 7 days a week. Because the Volatility 50 (1s) Index updates so rapidly, standard momentum calculations produce false line crossovers inside neutral territory. Traders who enter Rise/Fall contracts on these uncalibrated signals quickly find themselves caught on the wrong side of sharp mean-reversions.
To eliminate lag and filter out tick-level noise, you must adjust the underlying calculations of the indicator directly on your charting interface. Configuring a calibrated 14-5-3-3 parameter structure inside NexTrader Charts aligns your momentum triggers with genuine 1-minute cycle shifts.
How to Calibrate 14-5-3-3 Stochastic RSI on NexTrader Charts
The Stochastic RSI applies the Stochastic oscillator formula to a set of Relative Strength Index (RSI) values rather than raw price data. In a standard 14-14-3-3 configuration, the indicator takes a 14-period RSI and looks for the high-low range of that RSI over another 14 periods.
Analyze Deriv Markets Free
Pro-grade Deriv charts with 100+ indicators — RSI, MACD, Bollinger, Ichimoku. Synthetic indices, forex & crypto.
- 100+ Indicators
- Price Alerts
- All Timeframes
- Free Forever
On a 1-minute chart for the Volatility 50 (1s) Index, a 14-period Stochastic lookback spans 14 full minutes—representing 840 individual tick calculations. This extended lookback creates severe signal latency. By the time the %K line finally turns and crosses the %D line above 80 or below 20, the short-term price impulse on the 1-minute candle has already ended, leading to poor entry prices on Rise/Fall contracts.
Tightening the Stochastic Length from 14 down to 5 dramatically changes performance. A 5-period lookback compresses the evaluation window to 300 ticks, making the indicator sensitive enough to capture real-time momentum shifts without increasing false breakouts. Retaining the 14-period RSI length maintains structural baseline stability, while the 3-period %K and 3-period %D smoothings prevent erratic single-tick spikes from triggering premature line crossovers.
- 1 Open NexTrader Charts at NexTrader Charts and select Volatility 50 (1s) Index
- 2 Switch timeframe to 1-minute and add Stochastic RSI from the indicator menu
- 3 Open indicator settings and input RSI 14, Stoch 5, %K 3, %D 3
- 4 Save your layout using custom template saving for instant 24/7 access
To configure this layout on NexTrader Charts, select the Volatility 50 (1s) Index from the symbol directory and switch your chart view to the 1-minute (1m) timeframe using the top toolbar menu. Click the indicator button, search for "Stochastic RSI", and open its settings panel. Adjust the inputs as follows:
- RSI Length: 14
- Stochastic Length: 5
- %K Smoothing: 3
- %D Smoothing: 3
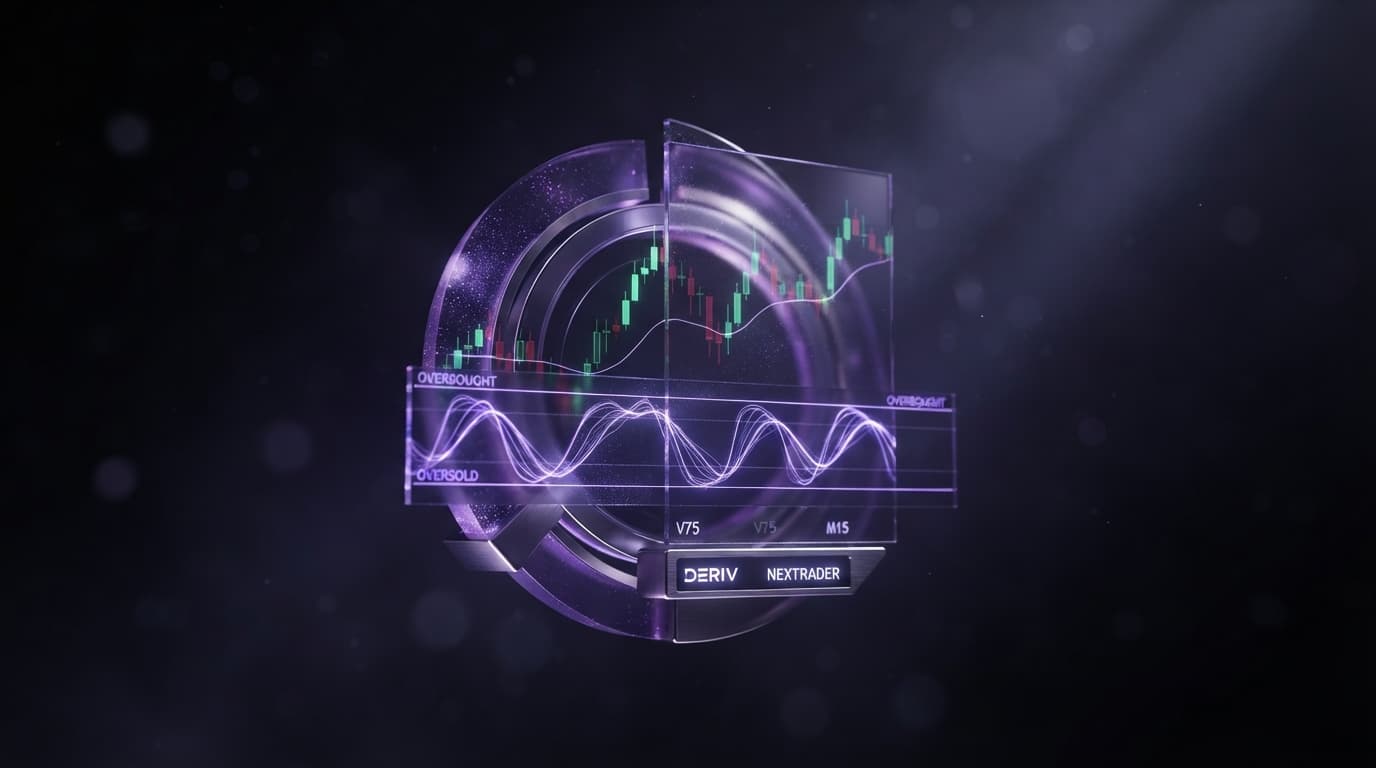
Once these numerical parameters are applied, adjust the visual horizontal boundaries inside the indicator settings panel to clearly delineate the 80 overbought threshold and the 20 oversold threshold.
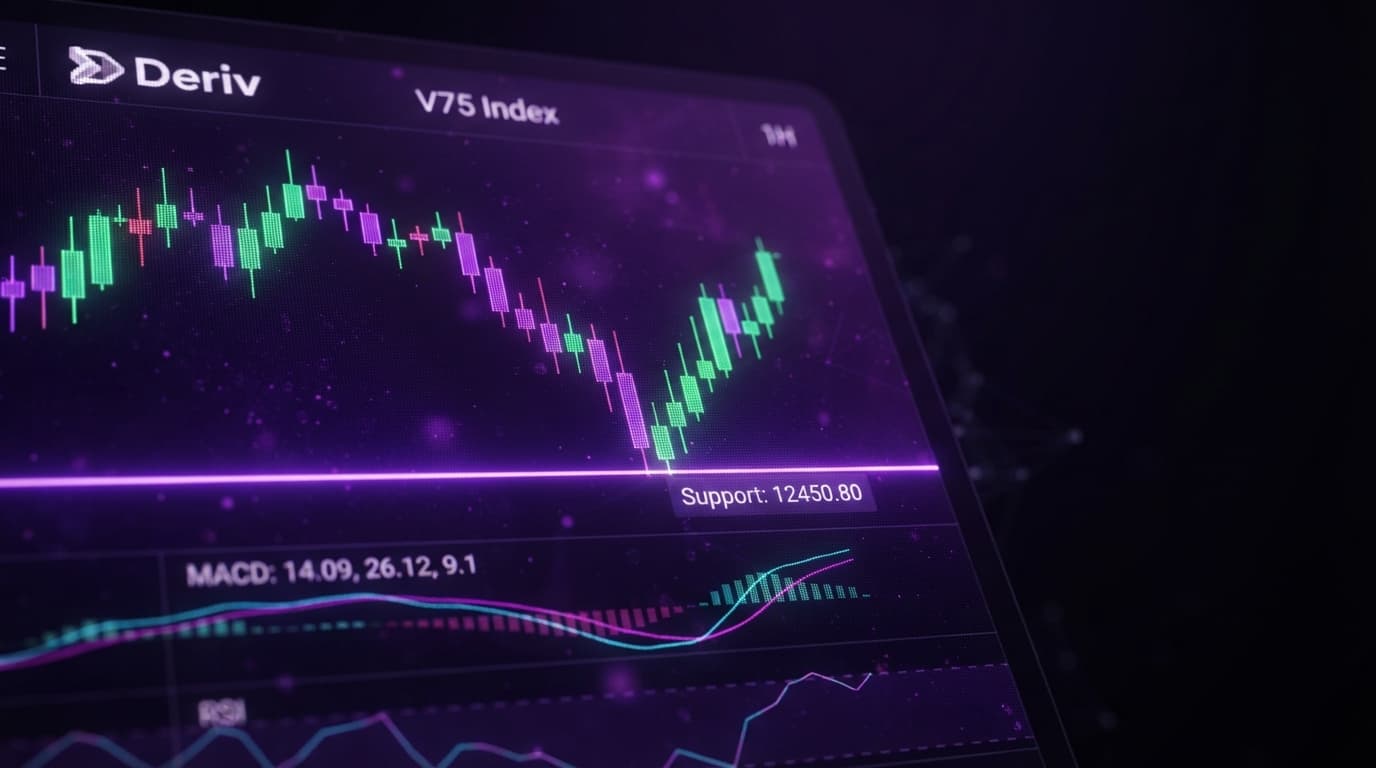
For maximum accuracy, do not trade the indicator in isolation. High-probability NexTrader chart analysis relies on combining momentum oscillators with key structural price levels. Use the built-in horizontal line drawing tools on NexTrader Charts to mark recent session highs, lows, and consolidated support/resistance zones directly on your deriv charts. When a calibrated 14-5-3-3 Stochastic RSI crossover aligns precisely with a drawn horizontal support or resistance level, setup probability increases significantly.
After customizing your workspace, save your active layout using the template saving feature inside NexTrader Charts. This ensures your calibrated NexTrader trading tools and chart templates are ready instantly whenever you return to trade 24/7 synthetic markets.
Signal Execution Rules for Rise/Fall Contracts on NexTrader Charts
Precise timing separates profitable trading setups from failed entries when executing short-duration contracts. Having calibrated stochastic rsi settings deriv traders rely on is only half the battle; you must adhere to strict crossover execution rules.
A valid signal requires the fast %K line to cross completely over the slow %D line strictly outside the neutral boundary zone. For a Fall contract signal, both lines must rise above the 80 threshold into overbought territory, followed by the %K line crossing below the %D line while above 80. For a Rise contract signal, both lines must dip below the 20 threshold into oversold territory, followed by the %K line crossing above the %D line while below 20. Crossovers occurring between 21 and 79 must be completely ignored, as they indicate mid-range noise rather than extreme momentum exhaustion.
The single most critical execution rule is the mandatory 1-minute candle close confirmation. During an active 1-minute bar, synthetic tick generation can cause the %K and %D lines to cross and uncross multiple times before the candle finishes forming. Entering a Rise/Fall contract mid-candle based on a temporary crossover exposes your capital to severe fakeouts.
Monitor the real-time bar timer on NexTrader Charts (NexTrader Charts) as the active 1-minute candle approaches its close. Only when the timer reaches zero and the bar fully closes with the line crossover intact is the signal confirmed.
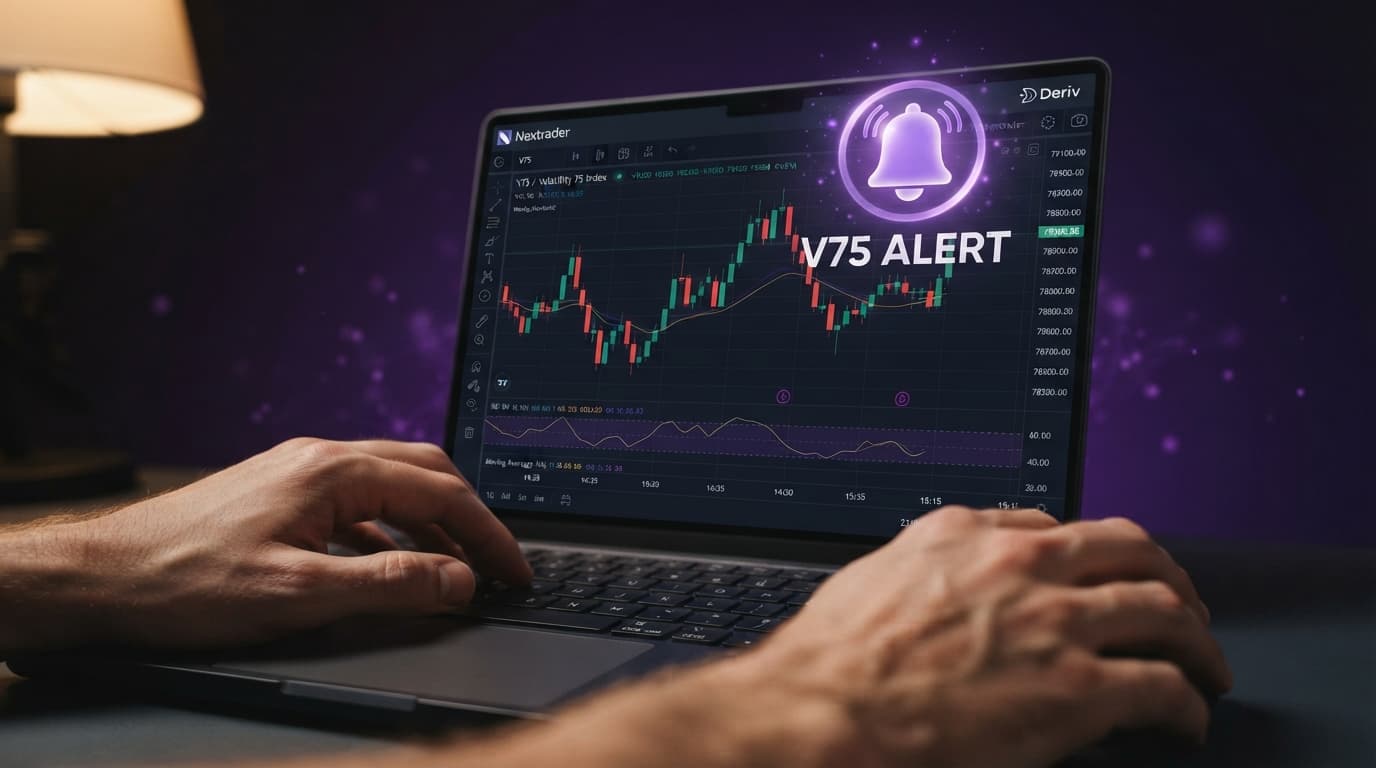
To streamline signal tracking across 24/7 market conditions, utilize the built-in price and level alerts on NexTrader Charts. Set custom alerts at the 80 and 20 indicator levels or on key horizontal price barriers. When an alert triggers, inspect the chart to verify whether the 1-minute bar close confirms the 14-5-3-3 crossover.
When executing Rise/Fall contracts off a verified 1-minute close:
- Align contract duration directly with the underlying momentum wave (typically 1 to 3 minutes or ticks depending on your contract structure).
- Ensure price is reacting to a key support or resistance level drawn on your workspace.
- Confirm that the momentum oscillator lines are clearly diverging out of extreme territory.
Stochastic RSI Do's and Don'ts for Deriv Synthetic Traders
Applying rigorous discipline prevents emotional errors during fast market conditions. Keep these essential guidelines in mind while conducting your deriv chart analysis on NexTrader Charts:
- DO: Calibrate your indicator parameters to 14-5-3-3 on NexTrader Charts before analyzing the 1-minute Volatility 50 (1s) Index.
- DON'T: Take crossover signals while the %K and %D lines are floating in the neutral zone between 20 and 80.
- DO: Wait for the active 1-minute candle to close fully on NexTrader Charts to confirm line crossover integrity before executing a Rise or Fall contract.
- DON'T: Trade default 14-14-3-3 settings on 1-second synthetic indices and expect real-time accuracy.
- DO: Combine 80/20 line crossovers with horizontal support and resistance levels drawn directly on your NexTrader Charts workspace.
- DON'T: Rely solely on momentum signals during extreme vertical trend expansions where indicator lines can remain pegged above 80 or below 20 for extended periods.
- DO: Save your 14-5-3-3 chart setup as a reusable template on NexTrader Charts and share technical insights with fellow traders in our official Telegram community (Telegram).
- DON'T: Pay for third-party indicator scripts or expensive charting subscriptions when professional-grade tools are 100% free with no paywalls on NexTrader Charts.
Start Analyzing Deriv Synthetics with Calibrated Tools Today
Everything described in this guide—from real-time WebSocket tick updates and 100+ technical indicators to custom deriv trading tools, alerts, and template saving—is completely free within the Nextrader ecosystem.
Launch your free analysis workspace on NexTrader Charts today, create your free account on the Nextrader App, and join thousands of active synthetic index traders in our official Telegram.
Trading involves risk. Past performance does not guarantee future results.