Master Support and Resistance Retests on Volatility 75 (1s) with NexTrader Charts
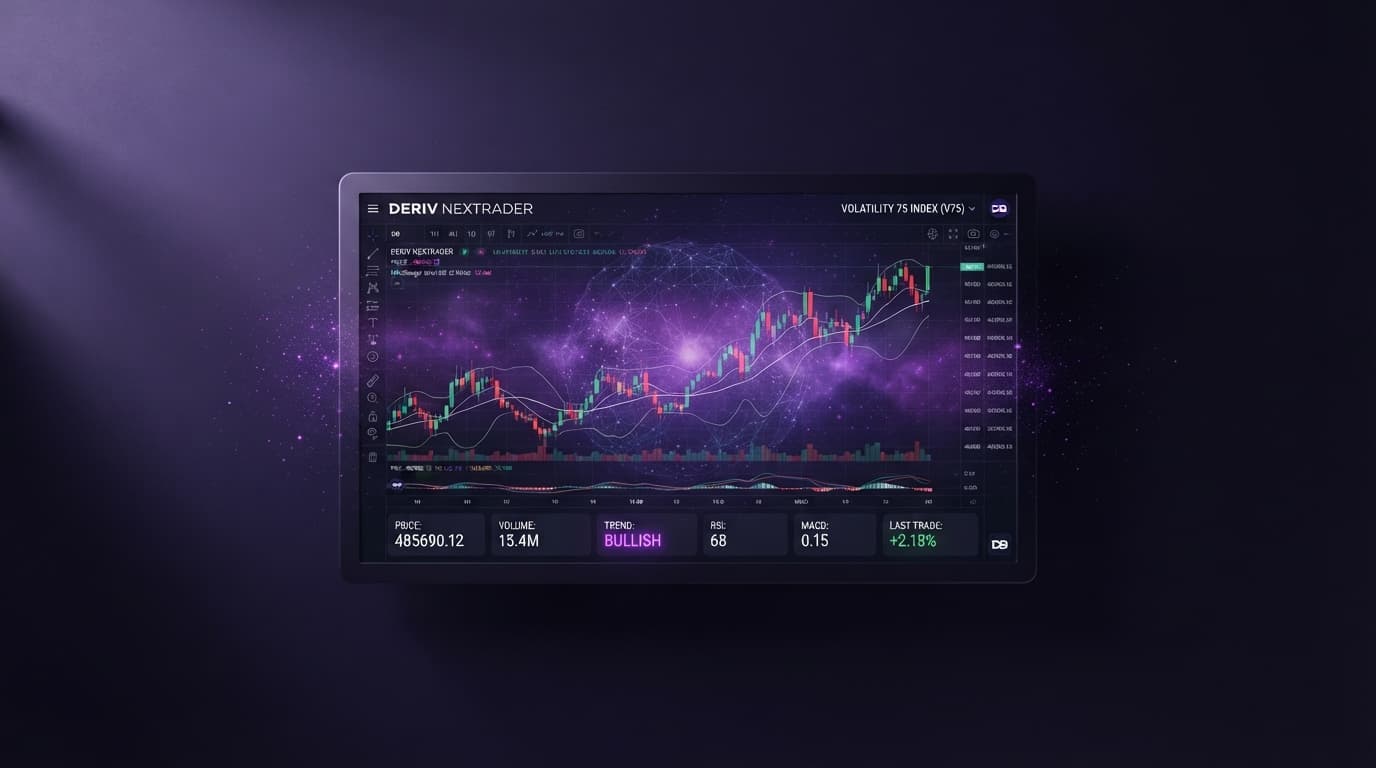
To trade support and resistance retests on Volatility 75 (1s), map key 15-minute swing boundaries on NexTrader Charts (NexTrader Charts), set price alerts right before the boundary, and confirm price deceleration on the 1-minute timeframe. Executing high-probability entries using a tailored support and resistance deriv framework requires real-time WebSocket feeds, rapid timeframe switching, and clean level plotting to prevent late entries and poor barrier placement.
Using specialized deriv trading tools like NexTrader Charts allows you to run real-time price alerts alongside 100+ technical indicators and drawing tools. By analyzing live price action on deriv charts built specifically for Deriv synthetic indices, you can plot structural S&R zones and calculate dynamic barrier offsets for High/Low Touch contracts before price reaches your entry level.
The 60-Second Version
- Open Volatility 75 (1s) on NexTrader Charts on the 15-minute timeframe.
- Draw primary support and resistance zones using drawing tools and Fibonacci levels.
- Set NexTrader price alerts 5–10 ticks ahead of the key support/resistance line.
- Drop to the 1-minute timeframe upon alert to confirm price deceleration (RSI divergence/rejection candle).
- Select a High/Low Touch contract with a dynamic barrier offset placed beyond the S&R zone.
Before You Begin
- Active Deriv trading account with sufficient capital balance.
- Live access to NexTrader Charts (NexTrader Charts) — 100% free, no login required to chart.
- 1 Map 15m S&R zones and Fibonacci levels on NexTrader Charts
- 2 Set native price alerts 5 to 10 ticks outside key boundary
- 3 Confirm 1m price rejection using RSI momentum divergence
- 4 Calculate barrier offset and execute Deriv High/Low Touch contract
Support and Resistance Deriv Walkthrough
Step 1: Map S&R Zones on NexTrader Charts (15m Timeframe)
Start by navigating to NexTrader Charts and loading the Volatility 75 (1s) symbol. Volatility 75 (1s) updates every second, meaning tick-level noise on lower timeframes can easily obscure major structural levels. Switch your chart timeframe to 15-minute (15m) to isolate significant institutional-grade liquidity pools.
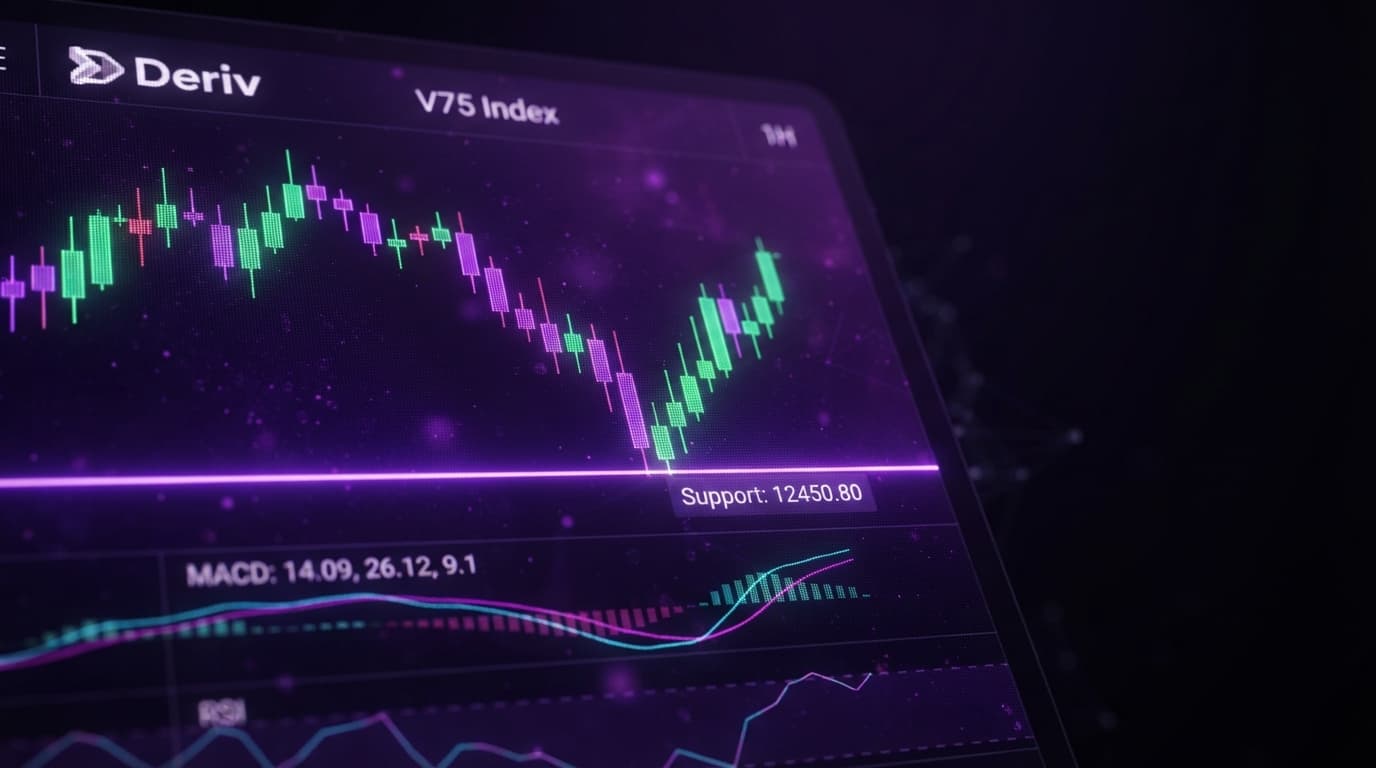
Select the rectangle and horizontal line tools from the NexTrader drawing palette. Scan the past 48 to 72 hours of price history on the 15m chart to identify obvious swing highs and swing lows where price previously underwent sharp reversals. Draw horizontal zones across these multi-touch points rather than thin single lines. A valid resistance zone represents a region where sellers repeatedly step in, while a valid support zone highlights active buying demand.
Analyze Deriv Markets Free
Pro-grade Deriv charts with 100+ indicators — RSI, MACD, Bollinger, Ichimoku. Synthetic indices, forex & crypto.
- 100+ Indicators
- Price Alerts
- All Timeframes
- Free Forever
To refine these horizontal boundaries, overlay the Fibonacci Retracements tool from the major high to the low of the prevailing swing leg. Identify confluent zones where the 0.382, 0.50, or 0.618 Fibonacci retracements align directly inside your horizontal S&R boxes. Confluence between structural swing points and Fibonacci levels creates high-probability rejection targets on Volatility 75 (1s).
Step 2: Set Real-Time Price Alerts & Multi-Timeframe Confirmation
Staring at 1-second ticks continuously creates screen fatigue, which leads to impulsive trading and forced entries. Once your 15m support and resistance zones are clearly marked, leverage the built-in price alert engine on NexTrader Charts.
Set price alerts 5 to 10 ticks ahead of the mapped S&R boundary (just above a support line or just below a resistance line). Because NexTrader Charts processes raw WebSocket feeds directly from the market, these alerts trigger in real time without lagging indicators or delayed candle closes. Immediately save your chart layout using the native template saving feature so your drawn zones, Fibonacci plots, and indicator configurations remain stored across sessions.
When your price alert fires, drop your chart timeframe down to 1-minute (1m) to observe the exact micro-structure of the approach. Perform detailed analysis on NexTrader Charts on this lower timeframe by looking for specific momentum exhaustion signals:
- RSI Divergence: Load the Relative Strength Index (RSI) with a standard period of 14. If price pushes into 15m resistance while the 1m RSI fails to make a higher high (or makes a lower high in overbought territory above 70), upward momentum is diminishing.
- Rejection Candle Structures: Look for prominent long-wick pin bars, dojis, or engulfing candle patterns printed directly against your marked 15m level.
- Moving Average Confluence: Check if price is extending away from or reacting against key moving averages (such as the 20-period Exponential Moving Average) on the 1m chart.
Step 3: Calculate Dynamic Barriers for High/Low Touch Contracts
When trading an S&R retest on Volatility 75 (1s), use the key boundaries mapped on NexTrader Charts to establish precise barrier offset distances for your High/Low Touch contracts. Aligning your touch barrier directly with key technical levels allows you to capture price expansions off support or resistance without relying on arbitrary targets.
To set your barrier offset accurately:
- Measure Current Distance: Check the exact tick gap between the current spot price on NexTrader Charts and your target S&R line.
- Determine Contract Type: If price is testing a major 15m support level and showing 1m RSI bullish divergence, select a High Touch contract (expecting a strong bounce upward) or a Low Touch contract set beyond the support floor (expecting support to hold without price breaching lower).
- Set Dynamic Barrier Offset: On Volatility 75 (1s), average 1-minute candle movement often ranges between 1,000 and 3,000 index points. Place your High Touch barrier offset within recent 1m candle expansion reach, ideally 500 to 1,500 points beyond current spot price toward the anticipated rejection path.
- Align Contract Duration: Match your contract duration (e.g., 2 minutes to 5 minutes) with the average time it takes V75 (1s) to complete a single 1m candle impulse swing.
Step 4: Execute and Log the Retest Trade
With your chart parameters verified on NexTrader Charts and your calculated barrier offsets set, execute your High/Low Touch contract on your Deriv account.
While the contract runs, monitor price action live on NexTrader Charts to observe how the V75 (1s) algorithm interacts with your marked level. Once the trade completes—whether it hits the touch barrier immediately or expires—click the screenshot tool on NexTrader Charts to capture the exact entry, level interaction, and technical structure. Keep these chart captures saved in your trading log to review win rates across different time of day and volatility regimes.
Mastering Deriv Chart Analysis: What Can Go Wrong
Even high-probability retest systems encounter unfavorable market conditions. Here are three common failure modes when trading S&R retests on Volatility 75 (1s) and how to fix them using NexTrader Charts tools:
- Premature Entry on Extreme Momentum Breakouts:
Problem:* Volatility 75 (1s) occasionally enters high-velocity trend expansions that slice clean through 15m support or resistance levels without halting. Entering blindly as price touches a line can lead to consecutive losses.
Fix:* Never execute a contract purely on a level touch. Require 1m timeframe confirmation on NexTrader Charts. Wait for a complete 1m candle close showing a rejection wick and RSI overbought/oversold confirmation before opening your trade position.
- Touch Barrier Offset Placed Outside Realistic Reach:
Problem:* Setting a High Touch barrier offset too far away from current spot price causes the contract to expire before price can reach the barrier, even when your direction bias is correct.
Fix:* Apply the Average True Range (ATR) indicator set to 14 periods on your 1m chart on NexTrader Charts. Use the ATR value to calculate your dynamic barrier offset. Keep touch targets well within 1.0 to 1.5 times the 1m ATR value.
- Loss of Chart Layouts and Drawn Support/Resistance Zones:
Problem:* Refreshing the browser or clearing cache deletes complex drawing analysis, forcing you to recalculate Fibonacci levels and S&R zones repeatedly.
Fix:* Take advantage of NexTrader Charts' chart template saving feature. Save your layout as a named template (e.g., "V75_1s_15m_SR") so you can restore your complete technical framework in a single click across sessions.
Start Now
Ready to refine your synthetic index entries with professional charting? Launch NexTrader Charts at NexTrader Charts, pull up the Volatility 75 (1s) chart on the 15-minute timeframe, and map your key support and resistance zones today.
Connect your trading with our ecosystem:
- Chart instruments live for free on NexTrader Charts: NexTrader Charts
- Access free trading utilities and create your account: Sign Up Free — Nextrader
- Join our official community on Telegram to share chart setups and technical analysis: Telegram
Trading involves risk. Past performance does not guarantee future results.