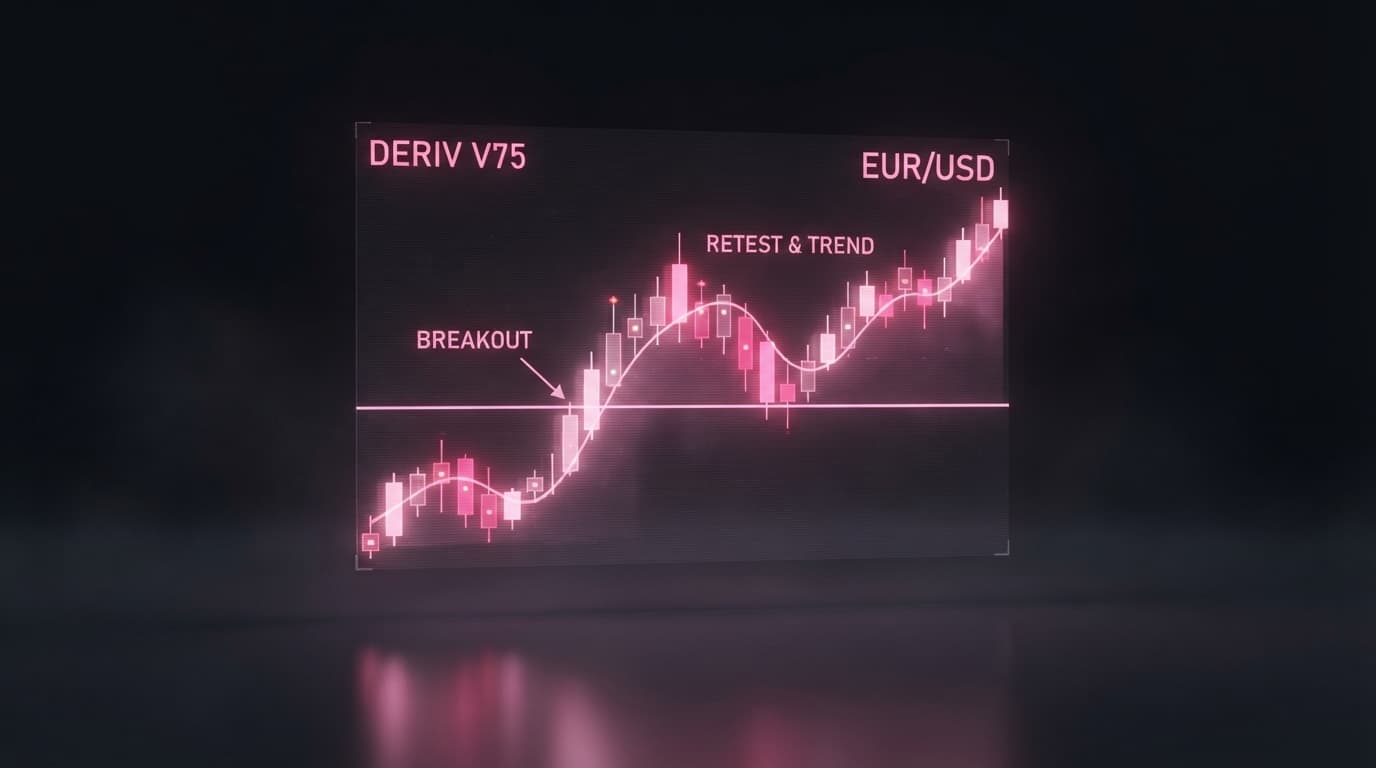
The most effective Bollinger Bands strategy for trading Deriv Volatility 75 (1s) is a 20-period, 2.5 Standard Deviation squeeze expansion model executed using NexTrader Charts (NexTrader Charts). By widening the standard deviation multiplier from the default 2.0 to 2.5, traders filter out structural micro-noise on hyper-volatile synthetic indices while isolating high-probability breakout momentum. This specialized bollinger bands deriv strategy targets high-speed volatility expansions across 1-minute and 5-minute timeframes, providing precise confirmation signals for timing Rise/Fall contracts on Deriv.
Executing this system requires an operational workspace capable of low-latency WebSocket data streaming. NexTrader Charts provides technical charting directly connected to Deriv real-time feeds, allowing traders to monitor real-time band squeezes, apply custom drawing tools, and set price alerts without paywalls or subscription tiers. Matching outer envelope breaches on a 1-minute chart with the baseline slope of a 5-minute chart yields a disciplined workflow for entering Rise/Fall positions with fixed expirations.
Configuring the 2.5 StdDev Bollinger Band Squeeze on Volatility 75 (1s)
To configure this strategy, open NexTrader Charts (NexTrader Charts) and select the Volatility 75 (1s) Index. Add the Bollinger Bands indicator from the technical indicators library and adjust the settings:
- Length / Period: 20 (Simple Moving Average baseline)
- Standard Deviation (StdDev): 2.5
- Source: Close
When standard 2.0 StdDev bands are used, price constantly pierces the upper and lower boundaries during mundane range-bound movement. Widening the parameter to 2.5 StdDev stretches the bands outward. Under normal Gaussian distribution, a 2.5 StdDev envelope contains roughly 98.76% of all price ticks. When a 1-minute candle manages to close outside this expanded boundary, it signals genuine directional order flow rather than random noise.
Analyze Deriv Markets Free
Pro-grade Deriv charts with 100+ indicators — RSI, MACD, Bollinger, Ichimoku. Synthetic indices, forex & crypto.
- 100+ Indicators
- Price Alerts
- All Timeframes
- Free Forever
- 1 Configure 20-period 2.5 StdDev Bollinger Bands on NexTrader Charts
- 2 Identify tight bandwidth contraction across 1-minute and 5-minute charts
- 3 Set price alerts on outer envelopes at NexTrader Charts
- 4 Wait for a 1-minute candle to close completely outside the 2.5 band
- 5 Execute a Rise or Fall contract matching the direction of the envelope breach
A valid squeeze occurs when the upper and lower bands contract tightly around the 20-period moving average baseline, contracting the total bandwidth to its lowest visual level over the preceding 50 candles. This contraction signals that kinetic volatility has compressed. As tick price oscillates within a tight corridor on the 1-minute chart, energy builds for an impending breakout.
Identifying volatility expansion and envelope breach confirmation
Entering a trade prematurely inside a squeeze often results in capital loss due to choppy whipsaws. You must wait for confirmation of volatility expansion before taking action on your Deriv account. Advanced deriv chart analysis relies on strict candle-close confirmation rules rather than reacting to temporary tick spikes.
A valid bullish expansion signal requires two distinct conditions:
- The distance between the upper and lower 2.5 StdDev bands begins expanding rapidly, turning outward in opposite directions.
- A 1-minute candle closes with its full body or major upper portion above the upper 2.5 Standard Deviation envelope.
Conversely, a valid bearish expansion signal requires the upper and lower bands to flare open while a 1-minute candle completes a full close below the lower 2.5 Standard Deviation envelope.
Bullish Breach Rule: Candle Close > Upper Band (2.5 StdDev) + Bandwidth Expanding
Bearish Breach Rule: Candle Close < Lower Band (2.5 StdDev) + Bandwidth Expanding
To streamline monitoring on NexTrader Charts, leverage built-in horizontal drawing tools to mark the high and low boundaries of the squeeze consolidation zone. Additionally, configure custom price alerts directly on the outer band coordinates. When the real-time Deriv WebSocket feed pushes price past your preset threshold, NexTrader Charts notifies you immediately, ensuring you never miss the initial breakout candle on 1m or 5m timeframes.
Always cross-reference the 1-minute setup with the 5-minute chart. If the 1-minute chart shows a bullish envelope breach above the 2.5 upper band, switch to the 5-minute timeframe on NexTrader Charts to verify that the 20-period baseline moving average is sloping upward. Aligning the micro-breakout with higher timeframe momentum drastically increases the win rate of your contract executions.
Timing Rise/Fall contract expirations on NexTrader Charts
Once an envelope breach is confirmed by a candle close outside the 2.5 StdDev band, timing your Deriv Rise/Fall contract duration determines whether your trade finishes in-the-money. Synthetic indices like Volatility 75 (1s) move fast, meaning contract expirations that are too long risk exposure to mean-reversion pullbacks.
When trading a 1-minute chart breakout on NexTrader Charts, set your Rise/Fall contract expiration duration to 2 to 3 minutes (or 2 to 3 ticks/bars equivalent on your execution portal). This duration captures the multi-candle momentum impulse that follows a statistical 2.5 StdDev breach without leaving the contract open long enough to get caught in the inevitable snap-back to the 20-period average baseline.
Execution Guidelines for Contract Expirations:
- 1-Minute Chart Trigger: Set contract expiration to 2 or 3 minutes. If the breakout candle closes strong with minimal wick, select Rise for upper breaches or Fall for lower breaches.
- 5-Minute Chart Trigger: Set contract expiration to 10 or 15 minutes. This allows broader macro-swings on V75 (1s) to complete their expansion leg.
You must avoid late entries. If price has already generated two consecutive extended candles outside the 2.5 StdDev envelope, the impulse phase is exhausted. Instead of chasing stretched moves, use the trendline and horizontal ray drawing tools on NexTrader Charts (NexTrader Charts) to map baseline support and wait for the next bandwidth contraction before placing new positions with deriv trading tools.
Optimizing your bollinger bands deriv strategy workflow with saved chart templates
On NexTrader Charts (NexTrader Charts), save your custom multi-indicator setups as reusable chart templates to instantly deploy strategies across active charts.
After overlaying your 20-period, 2.5 StdDev Bollinger Bands onto the Volatility 75 (1s) chart, save your setup as a custom template named "V75 2.5 Squeeze". You can then instantly apply this exact quantitative template across the entire suite of synthetic indices available through the real-time Deriv feed, including Volatility 10, 25, 50, and 100 (including 1Hz variants).
Because NexTrader Charts is 100% free with zero paywalls, subscriptions, or invasive ads, you access professional charting utilities directly powered by low-latency WebSockets. The platform allows multi-chart grid views, enabling you to display the 1-minute V75 (1s) breakout chart right alongside the 5-minute structural trend chart on a single screen.
Step-by-Step Daily Execution Checklist:
- Open NexTrader Charts (NexTrader Charts) and load your saved 2.5 StdDev Bollinger Band template on Volatility 75 (1s).
- Scan the 5-minute chart to determine the primary slope of the 20-period baseline average.
- Drop down to the 1-minute chart and look for bandwidth contraction (squeeze phase).
- Draw horizontal resistance across squeeze highs and support across squeeze lows using precision drawing tools.
- Set price alerts outside the upper and lower 2.5 StdDev envelope boundaries.
- Upon an alert, confirm that a 1-minute candle completes a full close beyond the 2.5 band while bands expand outward.
- Execute a 2-minute to 3-minute Rise or Fall contract on your Deriv account matching the breakout vector.
Executing this strategy with strict 2.5 Standard Deviation envelope closes and higher-timeframe baseline alignment ensures entries align with verified momentum spikes on Deriv synthetic markets.
Join thousands of active synthetic index traders in our official Telegram community at Telegram to share chart templates and real-time squeeze setups. To launch your free professional charting suite, visit NexTrader Charts today, or set up your trading workspace by registering at Sign Up Free — Nextrader.
Trading involves risk. Past performance does not guarantee future results.