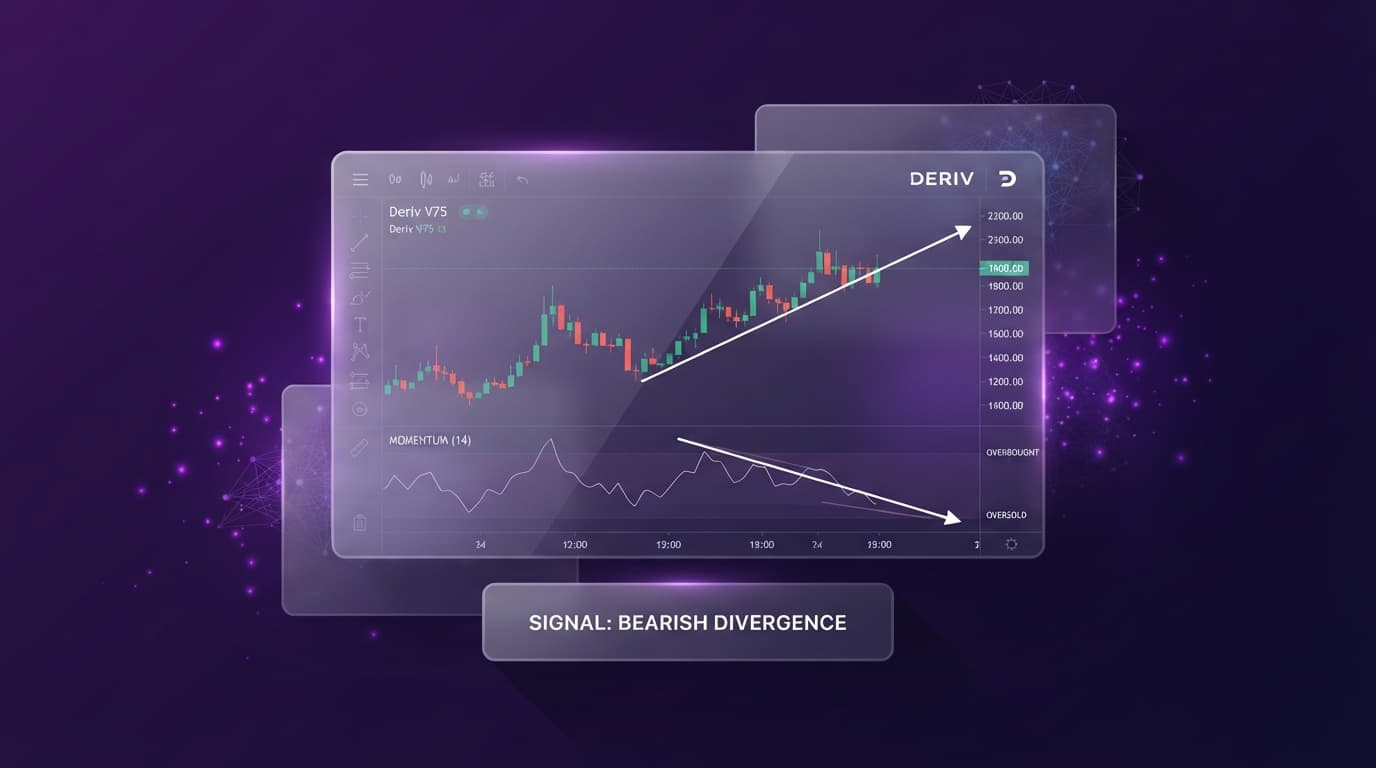
To trade Volatility 75 (V75) on the 5-minute timeframe without getting trapped by noise, the optimal rsi settings for volatility 75 are a 7-period lookback, strict 80/20 overbought/oversold levels, and a 9-period Moving Average overlay configured on NexTrader Charts. This calibrated formula provides a mathematically sound filter against the relentless momentum spikes inherent to Deriv's most active synthetic market.
Calibrating the 7-Period RSI Settings for Volatility 75 and 9 MA Overlay
Standard technical analysis configurations use a 14-period lookback with 70/30 outer thresholds for the Relative Strength Index (RSI). On a fast-moving M5 Volatility 75 chart, this standard setup creates two major structural errors: delayed entries due to excessive lookback lag, and false reversal signals during strong, persistent trends.
To eliminate these structural flaws, navigate to NexTrader Charts and launch the Volatility 75 Index on the 5-minute (M5) timeframe. The complete calibration process takes less than two minutes to configure.
- 1 Open V75 on M5 timeframe on NexTrader Charts
- 2 Apply 7-period RSI with 80/20 extreme thresholds
- 3 Attach 9-period Moving Average overlay directly to the RSI pane
- 4 Save layout using template saving for instant deployment
1. Reducing the RSI Lookback to 7 Periods
Access the indicator library inside NexTrader Charts and add the Relative Strength Index to your chart pane. Open the indicator parameters and change the length from 14 to 7.
Analyze Deriv Markets Free
Pro-grade Deriv charts with 100+ indicators — RSI, MACD, Bollinger, Ichimoku. Synthetic indices, forex & crypto.
- 100+ Indicators
- Price Alerts
- All Timeframes
- Free Forever
By shortening the lookback window to 7 periods, the indicator responds immediately to sudden tick velocity changes on the M5 timeframe. Synthetic algorithms on V75 often distribute or accumulate positions over brief 3-to-5 candle bursts. A 14-period RSI averages out these bursts, smoothing the line so much that by the time an overbought or oversold signal registers, the momentum leg is already exhausting itself. The 7-period setting exposes immediate directional pressure without introducing unbearable lag.
2. Tightening Upper and Lower Thresholds to 80 and 20
After setting the length to 7, modify the style parameters by moving the upper overbought threshold to 80 and the lower oversold threshold to 20.
Because Volatility 75 regularly undergoes aggressive vertical pushes, an indicator line calculated over 7 periods will routinely cross the standard 70 and 30 levels during routine pullbacks within a broader trend. Entering counter-trend trades at 70 or 30 on V75 leads directly to account drawdown. Requiring the 7-period RSI line to push beyond 80 or drop below 20 filters out routine noise, reserving trade consideration exclusively for genuine statistical extremes.
3. Adding the 9-Period Moving Average Smoothing Overlay
An extreme RSI reading above 80 or below 20 signals high momentum, but it does not tell you when momentum is actively turning. Entering the market simply because the line touched 80 often results in selling directly into a runaway bull move.
To fix this timing problem, add a 9-period Moving Average (MA) overlay directly into the RSI indicator pane on NexTrader Charts. Choose a Simple Moving Average (SMA) or Exponential Moving Average (EMA) calculated using the RSI output line as its input source. This secondary line acts as a dynamic trigger threshold inside the oscillator window. A valid trade signal occurs only when the fast 7-period RSI line crosses back through the 9-period Moving Average line after having reached an extreme 80 or 20 territory.
4. Saving the Configuration Template
Once your indicator pane accurately displays the fast 7 RSI line crossing the smoothed 9 MA line between the strict 80/20 boundaries, preserve your work. Click the template menu on NexTrader Charts and save the layout using native template saving. This allows you to deploy your calibrated settings instantly across synthetic index assets or lower timeframes without re-entering numerical parameters.
| Parameter / Feature | Standard RSI Configuration | Calibrated V75 NexTrader Setup |
|---|---|---|
| RSI Period | 14 | 7 |
| Threshold Levels | 70 / 30 | 80 / 20 |
| Smoothing Overlay | None | 9-period Moving Average |
| Primary Risk | High false-signal rate on M5 spikes | Delayed entry if volatility drops sharply |
| Execution Platform | Basic broker charts | NexTrader Charts |
M5 RSI Entry Protocols and Signal Verification on NexTrader Charts
Executing M5 trades on Volatility 75 requires coupling your calibrated 7-period RSI and 9 MA overlay with key market structure identified during deriv chart analysis on NexTrader Charts. Combining indicator confirmation with drawing tools prevents entering counter-trend spikes without structural confluence.
Short Setup Execution Protocol (Sell Signal)
When looking for high-probability short entries on the M5 timeframe, execute your analysis through three strict sequential checks:
- Structural Confluence: Use the horizontal line or rectangle drawing tools on NexTrader Charts to identify established horizontal resistance levels or key swing highs on the M5 or M15 chart. Never take a counter-trend short signal in middle-of-nowhere price territory.
- Extreme Momentum Reading: Observe price testing your resistance level while the 7-period RSI line breaks above the 80 boundary line on NexTrader Charts. This confirms that buyers are pushing with extreme force into a known historical supply zone.
- Overlay Crossover Trigger: Do not execute a trade while the RSI is rising above 80. Wait for the 5-minute candle to close where the RSI line crosses down back below the 9 MA overlay line. The moment this crossover occurs on a closed M5 bar, execute the short trade on your connected Deriv account. Place your stop-loss just beyond the recent swing high price spike.
Long Setup Execution Protocol (Buy Signal)
For long trades, apply the exact inverse of the short protocol:
- Structural Confluence: Map out major horizontal support floors or recent liquidity swing lows using NexTrader Charts drawing tools.
- Extreme Momentum Reading: Monitor price driving down into your support floor while the 7-period RSI drops below the 20 oversold line on NexTrader Charts.
- Overlay Crossover Trigger: Wait for price to react off support and for the M5 candle to close with the 7-period RSI line crossing back above the 9 MA overlay line. Enter the long trade on your connected Deriv account on the open of the next candle, setting a logical stop-loss below the localized low point.
Automating 24/7 Market Coverage via Price Alerts
Because synthetic indices trade continuously 24/7, monitoring the charts manually for hours can lead to fatigue. Set price alerts directly on NexTrader Charts near key support and resistance zones on Volatility 75. When price reaches your target structure, check the M5 chart for the 7 RSI and 9 MA overlay crossover before executing your trade on your connected Deriv account.
Applying strict 80/20 thresholds, a 7-period RSI lookback, and a 9 MA crossover on NexTrader Charts provides clear structural validation for V75 traders. Always confirm that price aligns with support or resistance drawing levels prior to taking signals.
To test these tools and refine your analysis setup on real-time synthetic data:
- Launch professional deriv trading tools at NexTrader Charts
- Set up your trading account via the NexTrader Registration Page
- Join thousands of synthetic index traders in our official Telegram
Trading involves risk. Past performance does not guarantee future results.