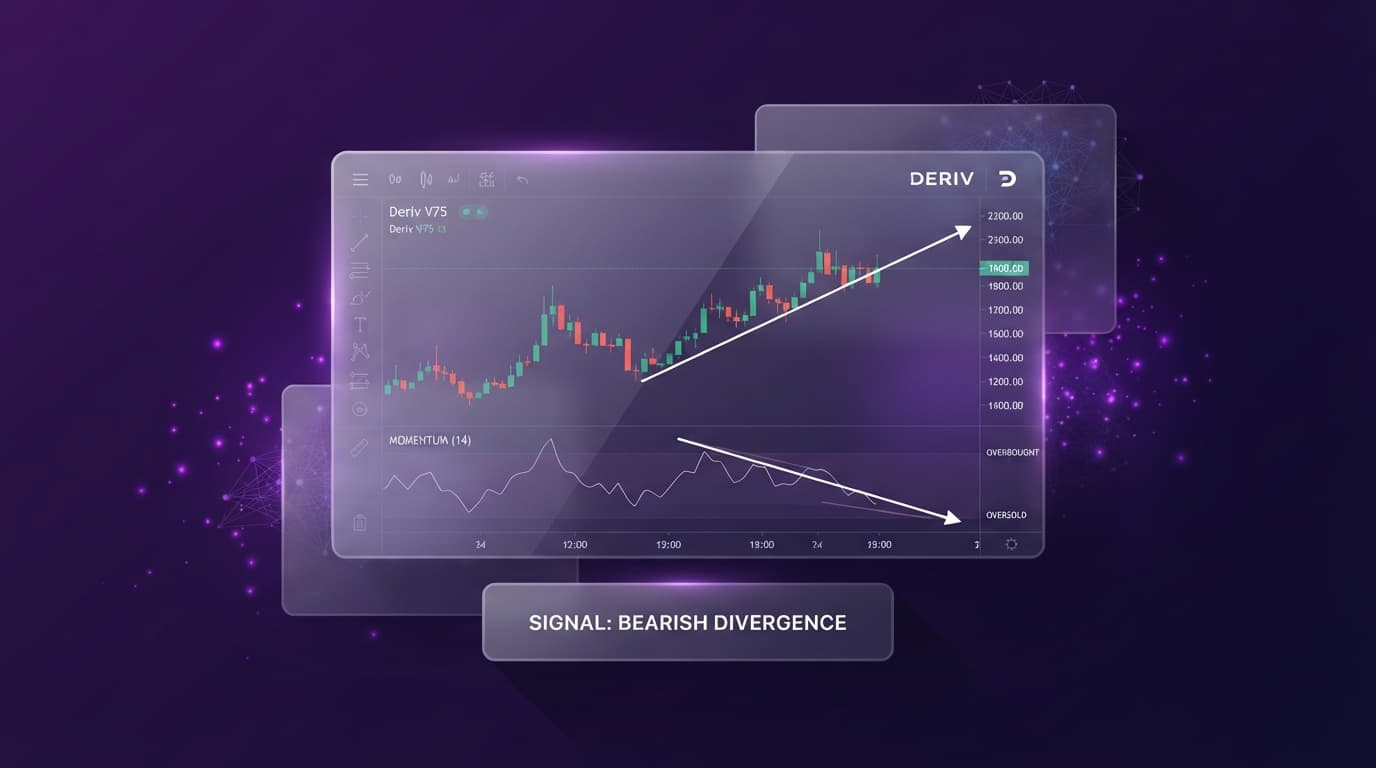
Most traders searching for a reliable boom and crash indicator are hunting for a mythical script that prints a green arrow one tick before a multi-hundred-point expansion occurs. On synthetic markets like the Boom 1000 Index, this search usually ends in frustration. Standard indicators repaint or lag severely because Boom 1000 mechanics are unique: price drifts downward in predictable, tiny one-second ticks and then explodes upward in violent single-tick spikes.
When you rely on single signal arrows, you trade past data that has already executed. Anticipating Boom 1000 spikes requires measuring market structural state changes rather than chasing individual candle shapes. Spikes are not random events; they are volatility expansions that naturally follow periods of intense low-volatility price compression.
By utilizing professional analysis on NexTrader Charts (NexTrader Charts), you can quantify these structural accumulation phases in real time. Combining 14-period ADX with 20-period Bollinger Bands creates a complete boom and crash indicator setup on NexTrader Charts. Rigorous technical analysis allows us to build a systematic model combining volatility bandwidth with trend strength filters, stripping away emotional guessing and replacing it with mechanical precision.
Myth vs. Reality: Why Single "Boom and Crash Indicator" Signals Fail
Retail trading forums are filled with custom indicators promising 99% accuracy on synthetic indices. The reality of how the Deriv algorithm generates tick data exposes why those tools constantly fail in live trading conditions. Synthetic indices use a cryptographic random number generator with fixed volatility parameters. On Boom 1000, the baseline probability creates a series of small downward ticks punctuated by sudden upward spikes averaging every 1000 ticks over vast mathematical distributions.
Analyze Deriv Markets Free
Pro-grade Deriv charts with 100+ indicators — RSI, MACD, Bollinger, Ichimoku. Synthetic indices, forex & crypto.
- 100+ Indicators
- Price Alerts
- All Timeframes
- Free Forever
Single-indicator tools attempt to apply standard momentum or oscillator formulas to this asymmetrical price distribution. An RSI or Stochastic Oscillator will remain stuck in oversold territory for extended periods during a prolonged downward tick sequence. If a trader opens buy positions every time the indicator touches oversold levels, the continuous tick decay bleeds their margin before a spike materializes. Conversely, moving averages lag behind the price action; by the time a moving average crossover confirms an upward turn, the spike has already completed and price is resuming its downward drift.
To successfully navigate these 24/7 synthetic markets, you need specialized deriv trading tools that analyze volatility cycles rather than directional lag. Volatility in financial and synthetic markets is cyclical: periods of high volatility are followed by periods of low volatility, and periods of low volatility are followed by explosive expansions. Spikes occur when price breaks out of extreme tight range compression.
- 1 Identify 5m macro structural support zone on NexTrader Charts
- 2 Wait for 1m ADX value to drop below 20 (accumulation phase)
- 3 Confirm Bollinger Band squeeze on 1m timeframe
- 4 Set real-time price alert at upper 2.0 SD band on NexTrader Charts
- 5 Execute buy position upon ADX expansion past 20-25 baseline
Instead of predicting the exact second a spike fires, institutional-grade execution on NexTrader Charts focuses on isolating the squeeze zones where risk-to-reward ratios heavily favor the trader. When you trade inside an established compression zone, your stop-loss distance is minimal, while your potential upside payout spans the full height of the impending volatility expansion.
Mechanical Setup: Mapping the ADX Squeeze Zone on NexTrader Charts
Setting up this mechanical strategy begins at NexTrader Charts. Our platform leverages 100% free professional charting technology specifically optimized for Deriv instruments, giving you multi-timeframe precision, fast execution analysis, and smooth data rendering without paywalls.
Select the Boom 1000 Index as your target instrument. Because synthetic indices trade continuously 24/7/365, structural patterns repeat reliably across all session times. Our core setup combines two complementary technical indicators to isolate high-probability spike initialization zones:
- Bollinger Bands (20-period, 2.0 Standard Deviations): Standard Bollinger Bands measure statistical dispersion around a simple moving average. When price compresses into a tight horizontal range, the upper and lower bands contract rapidly toward each other. This event—known as a Bollinger Band squeeze—signals that market volatility has hit cyclical lows.
- Average Directional Index (ADX, 14-period): The ADX measures the absolute strength of a trend regardless of direction. We utilize a strict baseline filter threshold at 20. When the ADX line drops below 20, it indicates that the current downward tick drift has lost structural momentum, placing the market into a range-bound accumulation phase.
Multi-Timeframe Workflow Execution
Navigating the setup requires a systematic top-down workflow across timeframes:
- 5-Minute Timeframe (5m): Map macro support zones and multi-hour consolidation structures. Identify where price has previously spiked off historical demand levels. Never enter a spike-buying trade if the 5m trend is making aggressive lower lows far away from structural support.
- 1-Minute Timeframe (1m): Apply your Bollinger Bands (20, 2.0) and ADX (14). Look for alignment where the 1m ADX falls below 20 while the Bollinger Bands contract into a narrow horizontal channel.
- The Signal Trigger: The execution phase activates when ADX turns upward, crossing from below 20 past 20–25, simultaneously accompanied by the upper Bollinger Band fanning outward. This expansion confirms that low-volatility accumulation has ended and volatility expansion has begun.
Automate your workflow to avoid sitting in front of monitors for hours waiting for this squeeze to form. Once you have applied the 20-period Bollinger Bands and 14-period ADX to your chart, click template saving inside NexTrader Charts. Storing this custom layout allows you to instantly deploy the precise setup across other synthetic indices like Boom 500, Crash 1000, or Crash 500 with a single click.
Next, right-click the upper 2.0 standard deviation Bollinger Band line on the 1m chart and select price alerts. Set a real-time price alert to trigger the instant price touches or pierces the upper squeeze boundary. Setting native platform alerts ensures you receive immediate notifications the exact moment a squeeze breaks out, allowing you to capture spike initialization cleanly without manual fatigue.
Execution Rules: Do's and Don'ts for Boom 1000 Spike Initialization
Executing spike trades on Boom 1000 requires strict adherence to risk management parameters. Because synthetic tick decay can erode capital if a setup fails, execution must follow defined quantitative controls.
When trading the ADX squeeze setup, your entry should occur near the bottom or middle of the Bollinger Band compression channel while ADX is below 20. Place your risk boundary a defined number of ticks below the lowest swing low of the consolidation structure. If price continues to tick downward and breaks structural support without ADX turning up, exit the position immediately. Never hold a losing position hoping for a miracle spike when the bandwidth is actively expanding downward.
Position sizing should remain uniform across all trades. Calculate your lot size based on the point distance between your entry price inside the squeeze band and your predefined invalidation level below support. By risking a fixed percentage of your account balance per setup (typically 1% to 2%), you can comfortably endure consecutive small tick drawdowns while waiting for multi-hundred-point spike expansions that yield 1:3 or 1:5 risk-to-reward ratios.
By pairing real-time volatility measurement tools with automated alerts and multi-timeframe confirmation, you shift your trading away from retail indicator hype toward professional market execution.
Access live charting, 100+ technical indicators, and real-time alerts at NexTrader Charts. Join active synthetic index traders in our official Telegram.
Trading involves risk. Past performance does not guarantee future results.