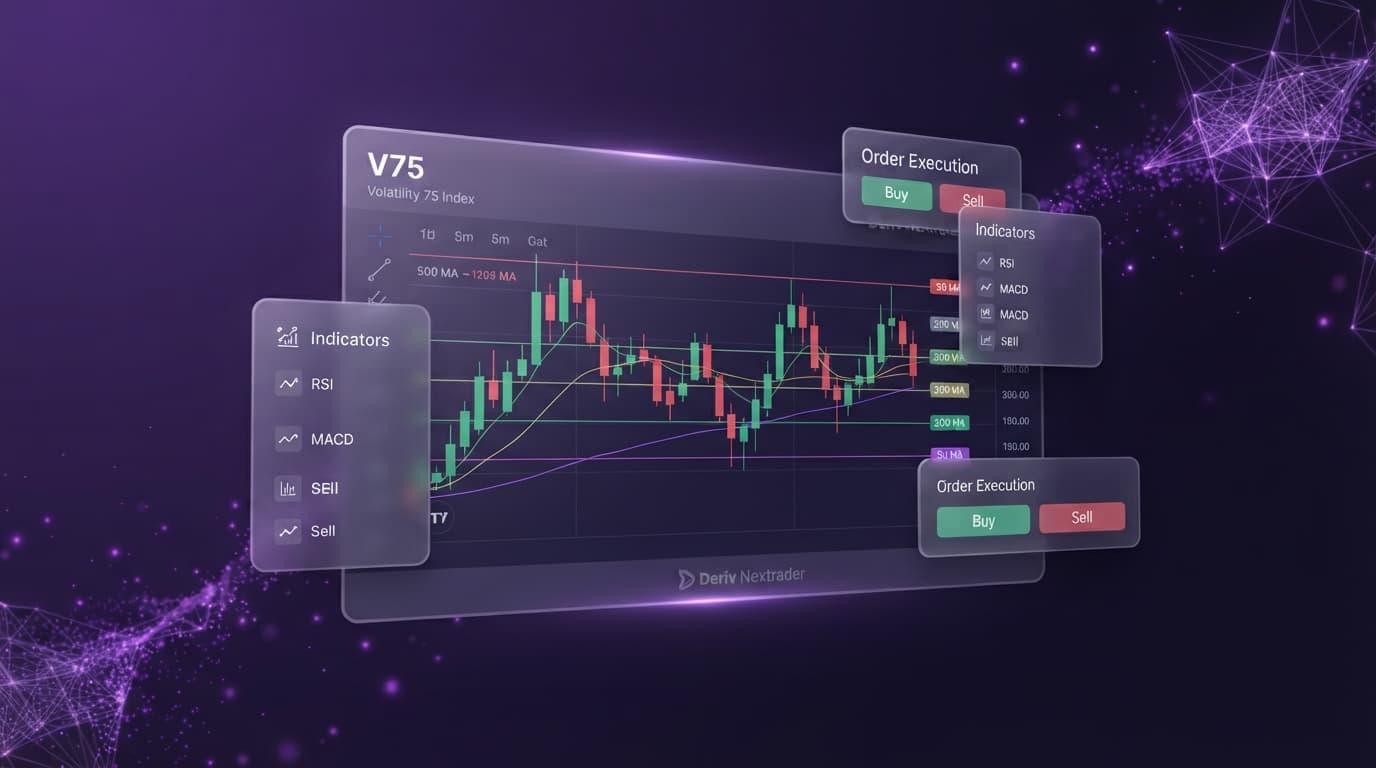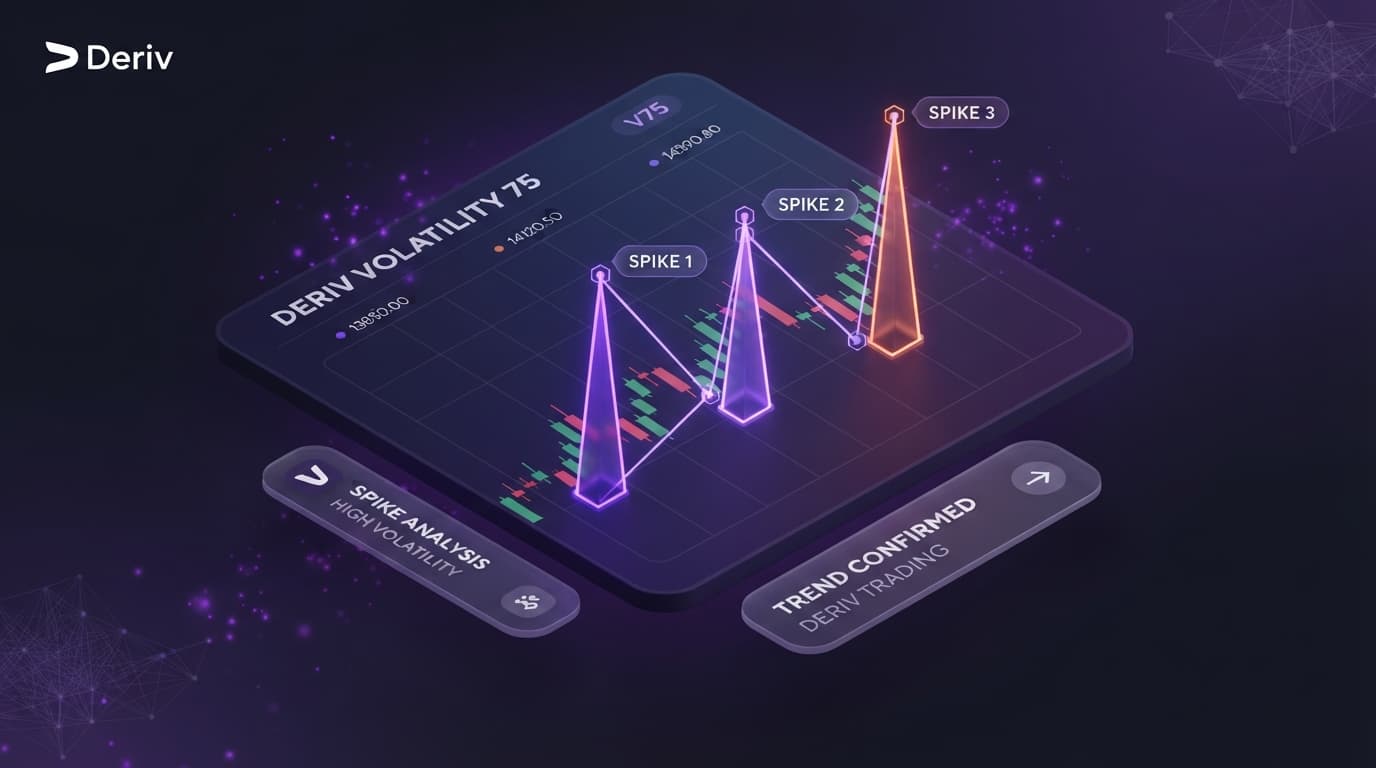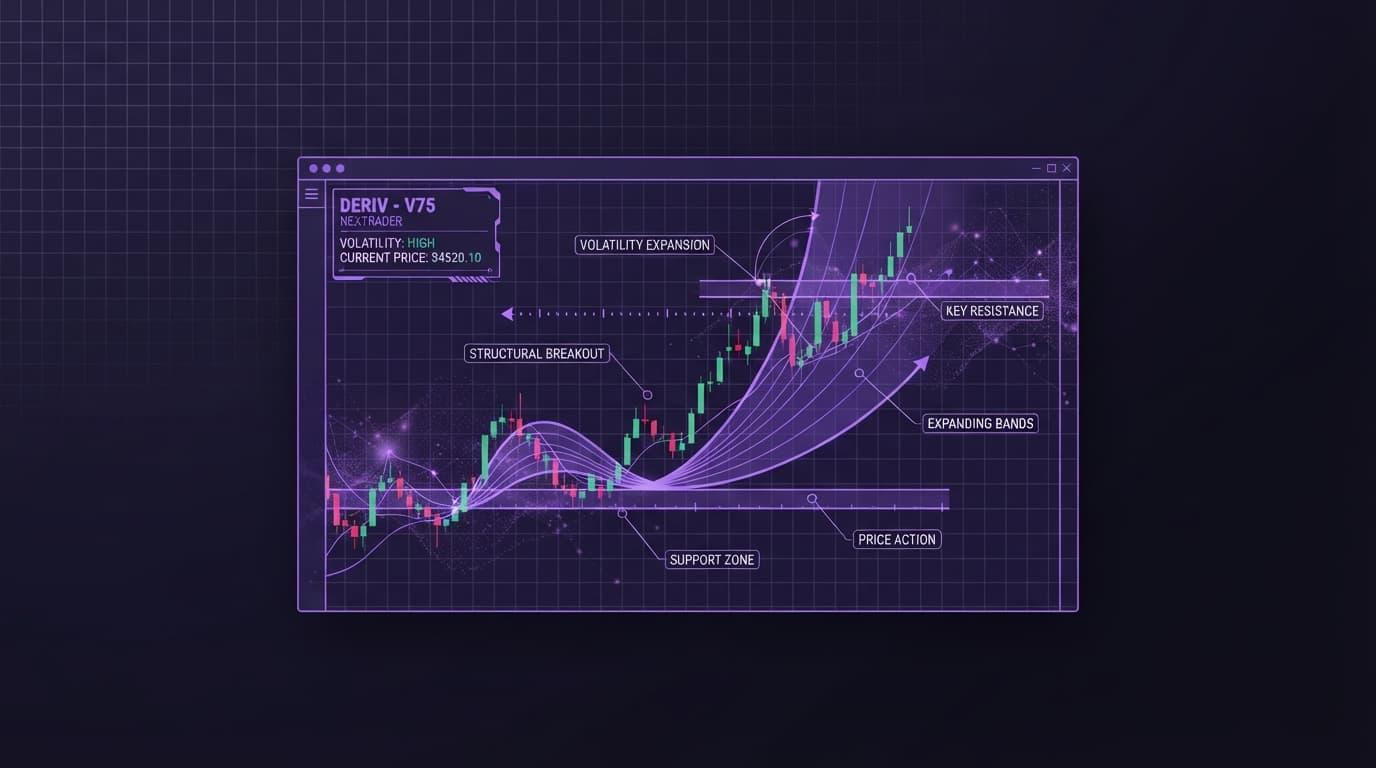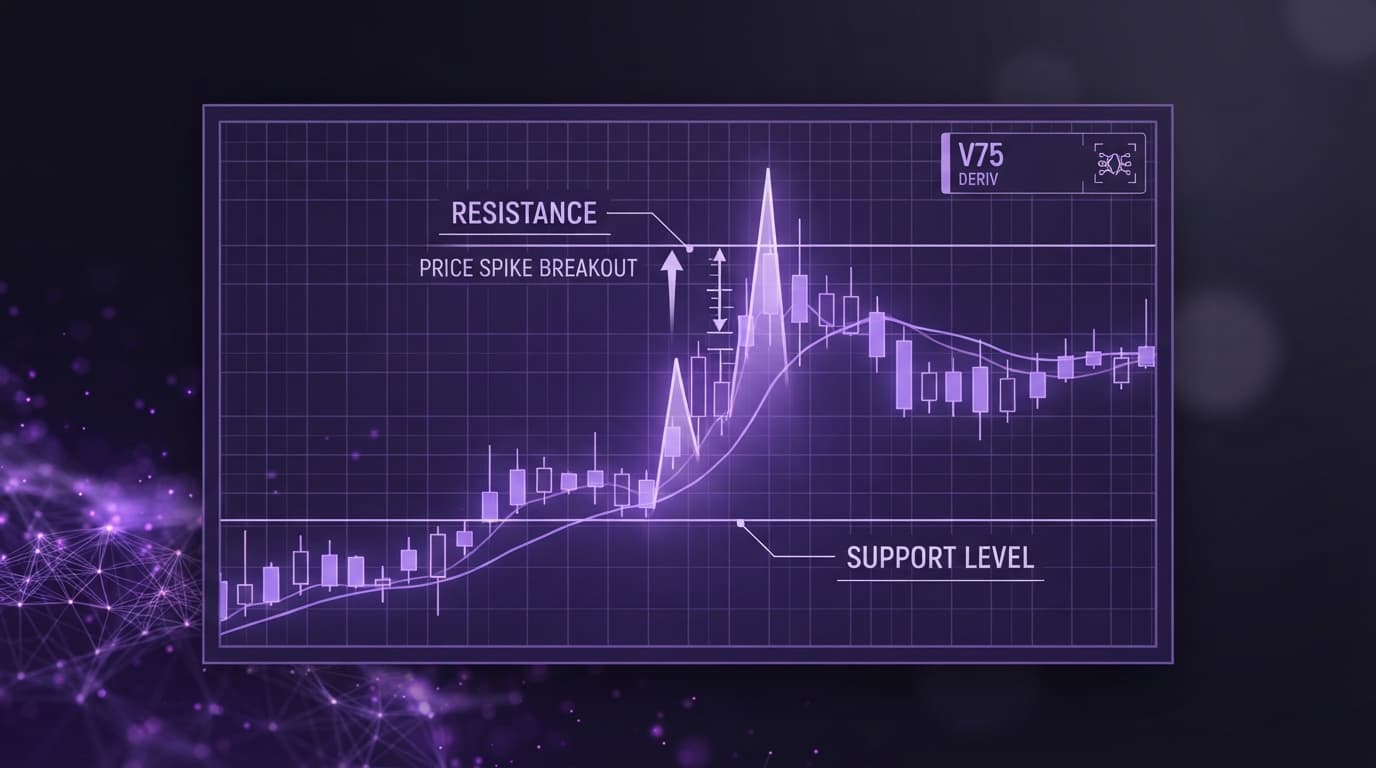
How do you trade a Volatility 100 breakout on Deriv using free charting tools? Catching a clean breakout on Volatility 100 (V100) requires precise horizontal support and resistance mapping combined with instant price notifications so you never miss the initial move. By mapping key consolidation levels on NexTrader Charts and setting real-time price alerts, traders can execute high-probability technical analysis setups without staring at charts for hours on end.
Volatility 100 is notorious for rapid price shifts and strong trending impulse moves once critical structural levels break. During a recent session, V100 entered a tight four-hour consolidation range between 12,450 and 12,520. Traders utilizing free deriv charts on NexTrader needed a disciplined approach to prepare for the expansion while keeping stop-loss parameters tightly controlled.
Relying on outdated or slow deriv trading tools often leaves traders guessing when a breakout is real versus a false push. Utilizing the interactive drawing tools on NexTrader allowed us to plot exact trendlines, mark multi-touch support lines, and define precise confirmation rules well before committing live capital to the position.
Mapping the Volatility 100 Consolidation Zone
Before placing an order, solid deriv chart analysis demands identifying clear market structure. On the 15-minute timeframe, V100 repeatedly bounced off a well-defined horizontal support floor while printing lower highs against a descending resistance line. Using the trendline and rectangle tools on NexTrader Charts, we visually boxed the consolidation zone.
Analyze Deriv Markets Free
Pro-grade Deriv charts with 100+ indicators — RSI, MACD, Bollinger, Ichimoku. Synthetic indices, forex & crypto.
- 100+ Indicators
- Price Alerts
- All Timeframes
- Free Forever