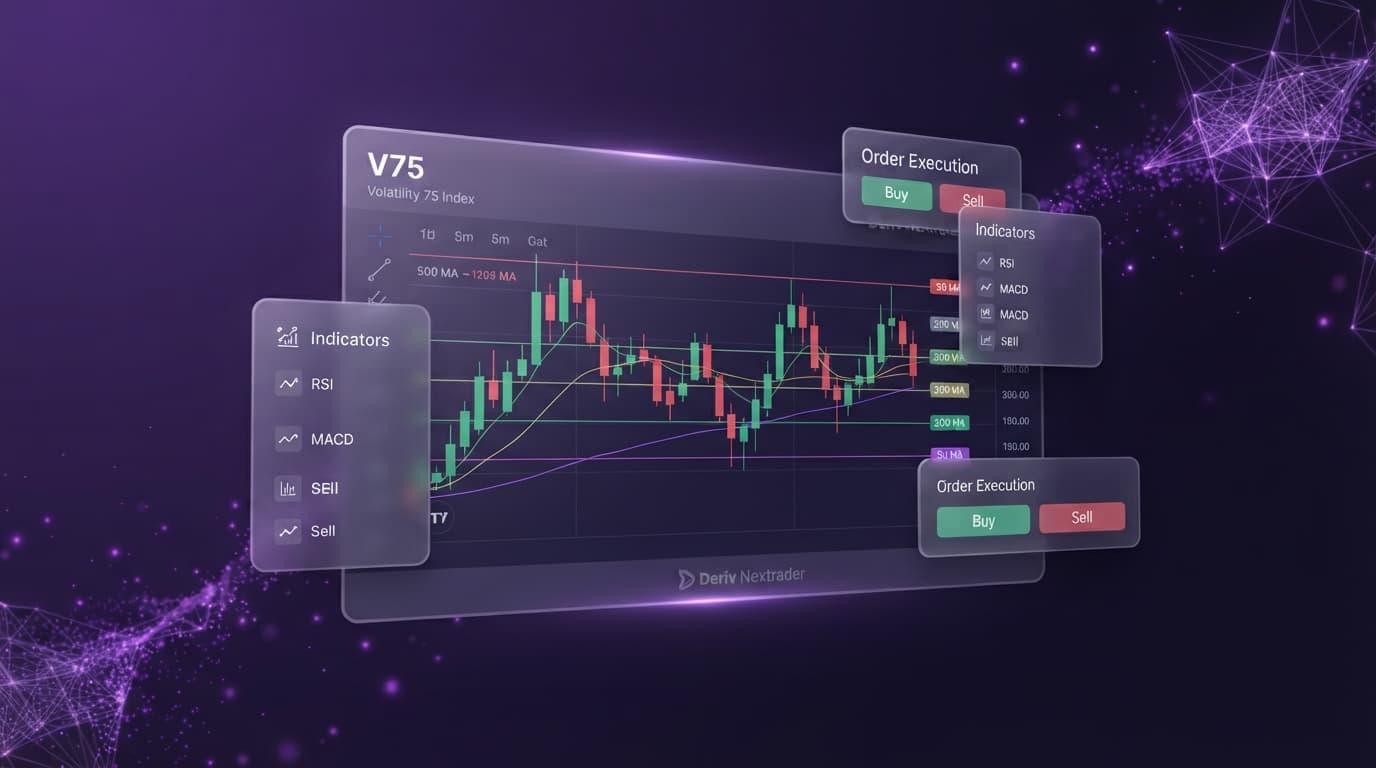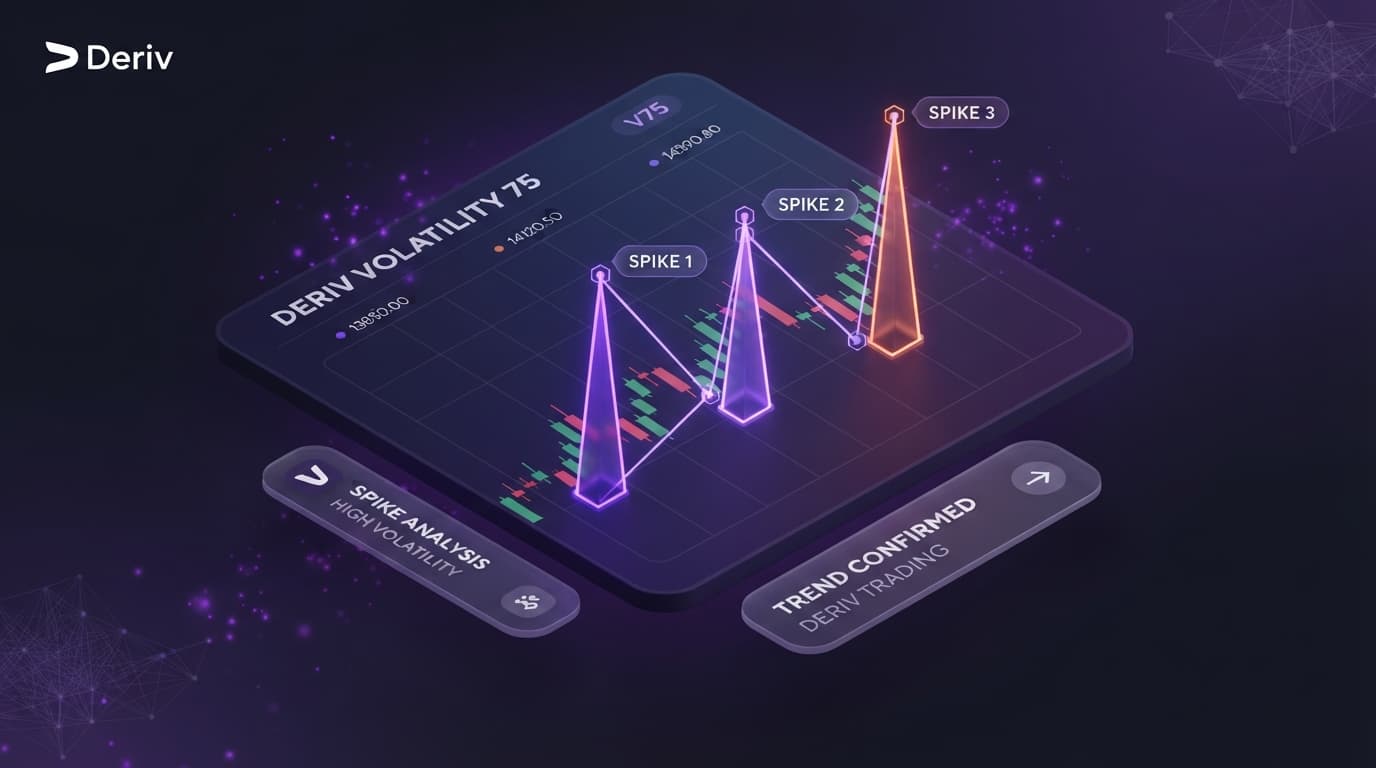
Bollinger Band Squeeze breakouts capture violent trend accelerations on the Deriv Volatility 75 Index (V75), whereas RSI Divergence reversals identify exhaustion points at key levels—making squeezes superior for trend-following momentum and divergence better suited for timing tops and bottoms. Trading the Volatility 75 Index requires fast execution and reliable charting because price movements move exponentially. Opening up high-performance deriv charts allows traders to plot volatility cycles before placing contracts. When using NexTrader Charts, combining volatility bands with momentum oscillators gives you a complete view of structural shifts. Both strategies provide high-probability setups, but they perform under completely different market conditions.
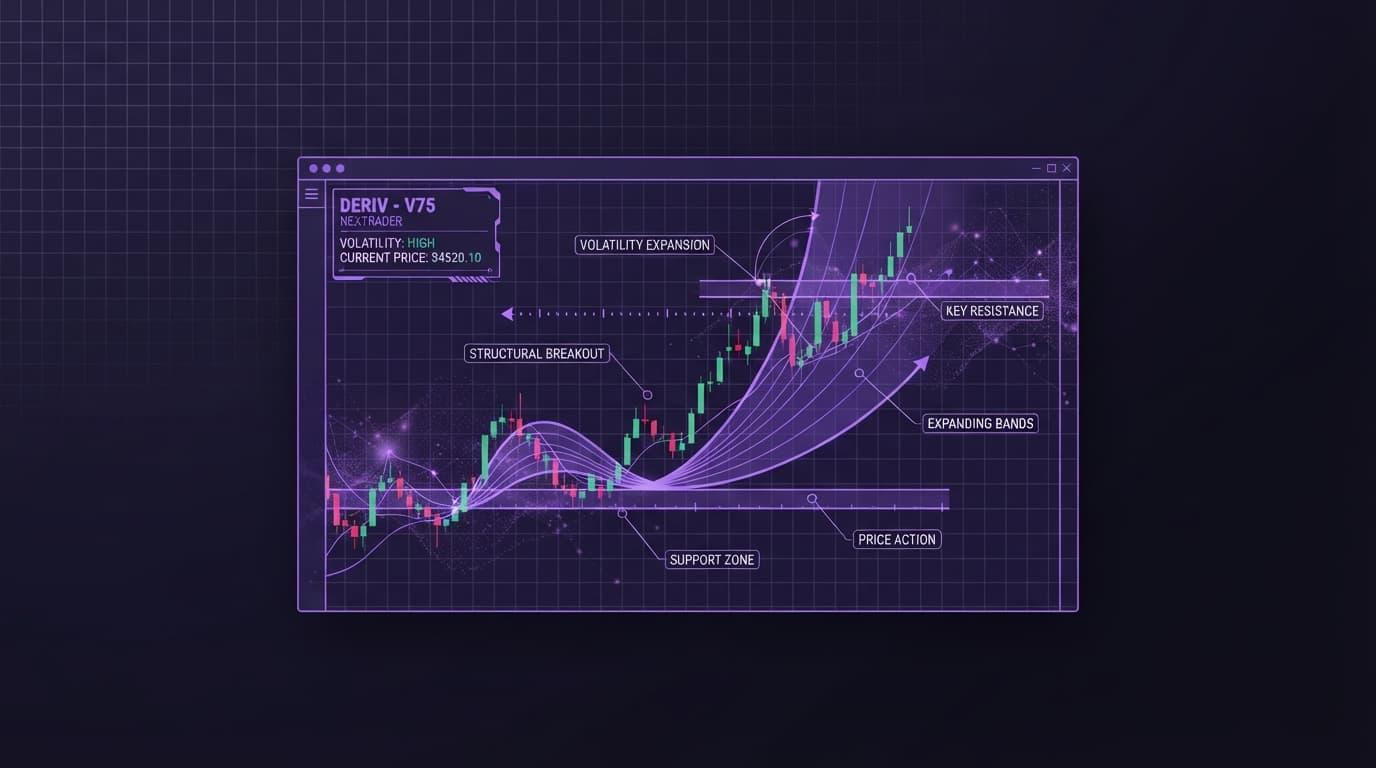
The Bollinger Band Squeeze occurs when the upper and lower bands contract tightly around price, indicating a period of low volatility. On V75, quiet consolidation almost always precedes an explosive move. Once price breaks decisively outside the contracted bands with expanding bandwidth, a momentum entry triggers. The main advantage is riding a massive, uninterrupted trend. However, false breakouts during choppy ranging periods can cause frustrating whipsaws if risk management is loose.
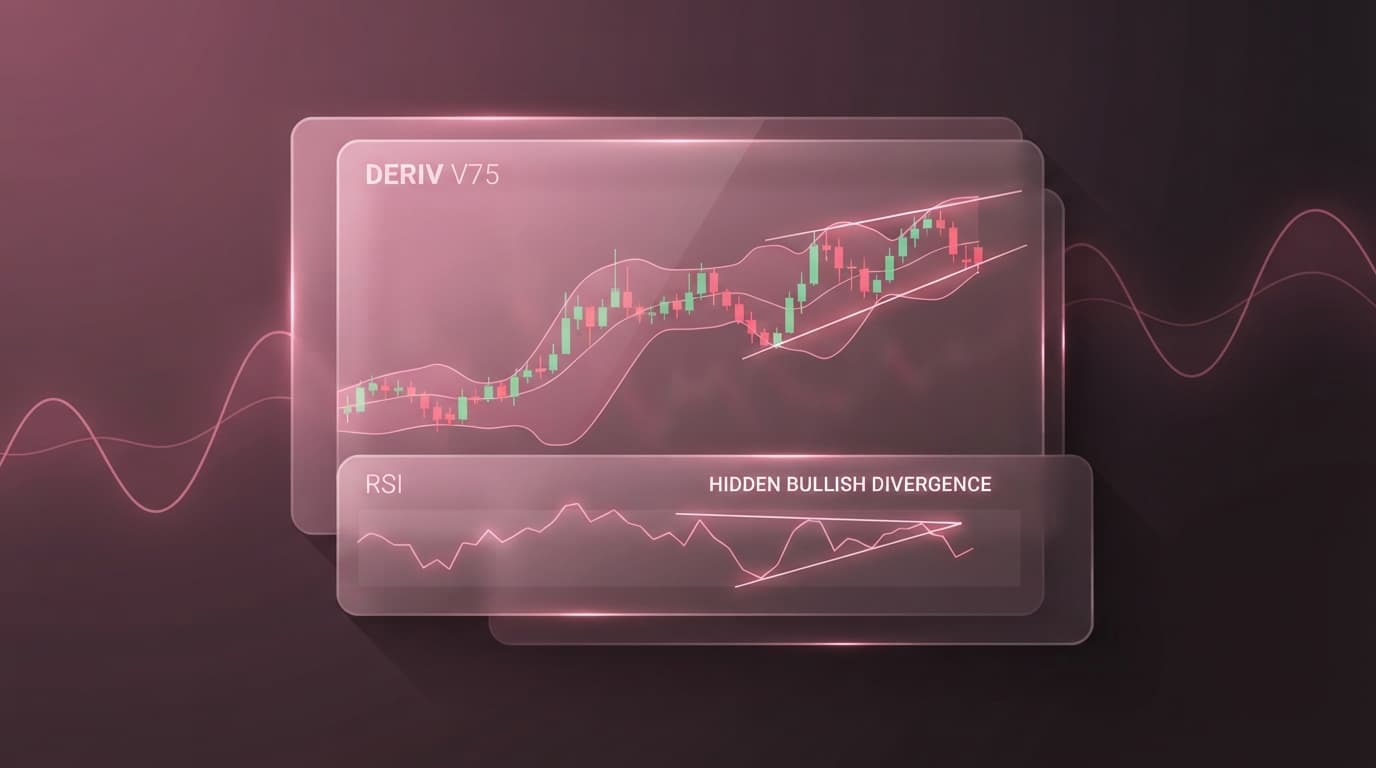
Conversely, RSI Divergence reversals focus on spotting momentum loss when price creates higher highs or lower lows. Performing precise deriv chart analysis with the Relative Strength Index helps highlight hidden exhaustion. Bullish divergence forms when price prints a lower low while the RSI makes a higher low, signaling fading bearish pressure. While this technique catches major market turns early, trading against strong V75 momentum can lead to early entries if the underlying trend continues longer than expected.
Comparing Strategy Performance on Volatility 75
Applying technical analysis to 24/7 synthetic indices means adapting to relentless continuous tick data. Squeeze breakouts excel during high-volatility expansions, letting you capture hundreds of pips in minutes. Meanwhile, RSI divergence shines during overextended multi-leg moves near key support or resistance zones. Utilizing free deriv trading tools gives you the speed needed to mark these levels accurately without lagging indicators.
Analyze Deriv Markets Free
Pro-grade Deriv charts with 100+ indicators — RSI, MACD, Bollinger, Ichimoku. Synthetic indices, forex & crypto.
- 100+ Indicators
- Price Alerts
- All Timeframes
- Free Forever
| Strategy Feature | Bollinger Band Squeeze Breakouts | RSI Divergence Reversals |
|---|---|---|
| Best Market Environment | Low-to-high volatility transitions | Overextended trends at key S/R levels |
| Primary Advantage | Captures massive trend momentum early | Excellent risk-to-reward on turns |
| Main Drawback | Vulnerable to fakeouts in ranges | Risk of premature entry against trends |
| Ideal Timeframes | 1m to 15m for rapid scalping | 15m to 1h for macro shifts |
Optimizing Your Execution with NexTrader Charts
Setting up your analysis template on NexTrader Charts is simple and completely free. Start by overlaying standard 20-period Bollinger Bands alongside a 14-period Relative Strength Index. Use drawing tools to trace trendlines across both price highs and the RSI line to confirm divergence before placing a trade.
Save your customized workspace so your indicators persist across sessions. Setting price alerts around compressed band boundaries or overbought thresholds ensures you never miss a volatile expansion on V75. Testing both setups across different timeframes on free charts helps you determine which strategy fits your individual trading style.
Ready to upgrade your technical setups? Analyze live synthetic markets for free at NexTrader Charts. Register your trading account via NexTrader App and join our growing community on Telegram.
Trading involves risk. Past performance does not guarantee future results.