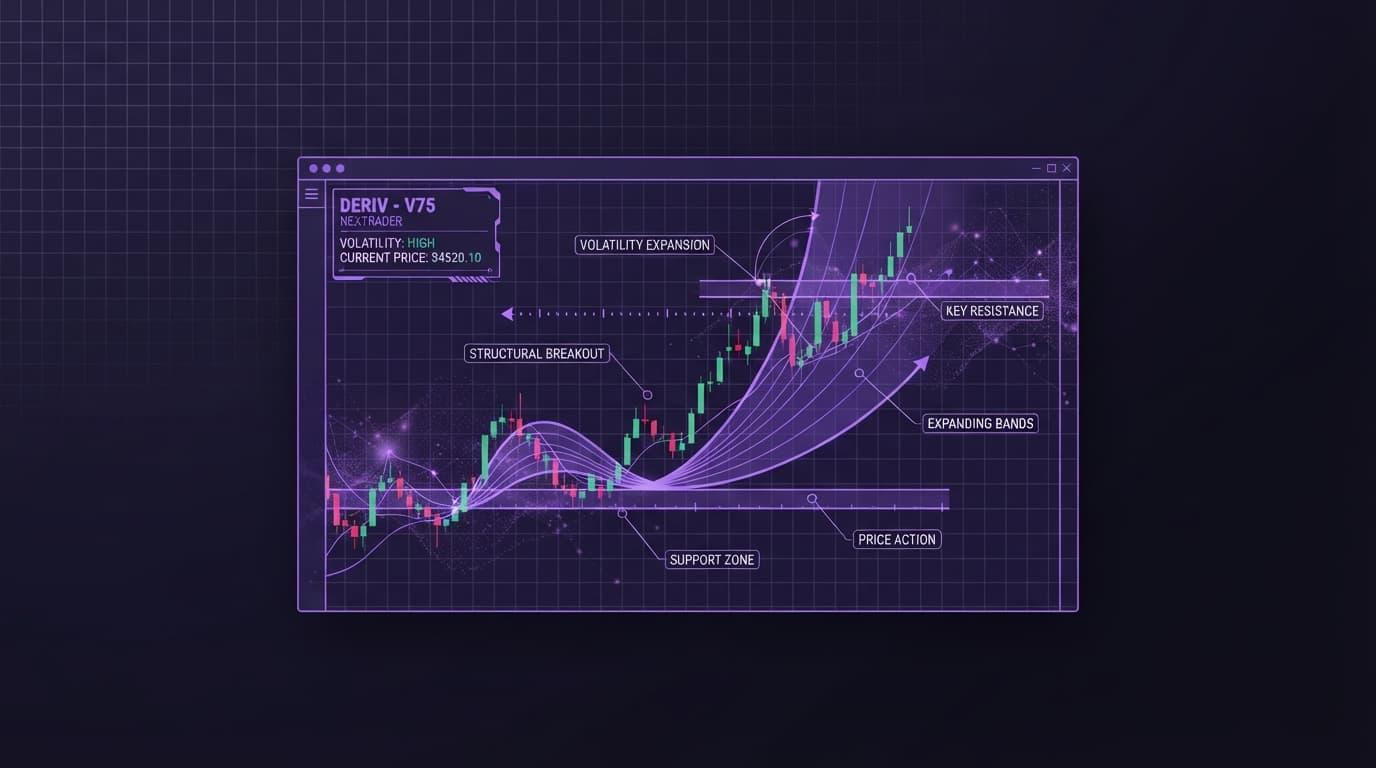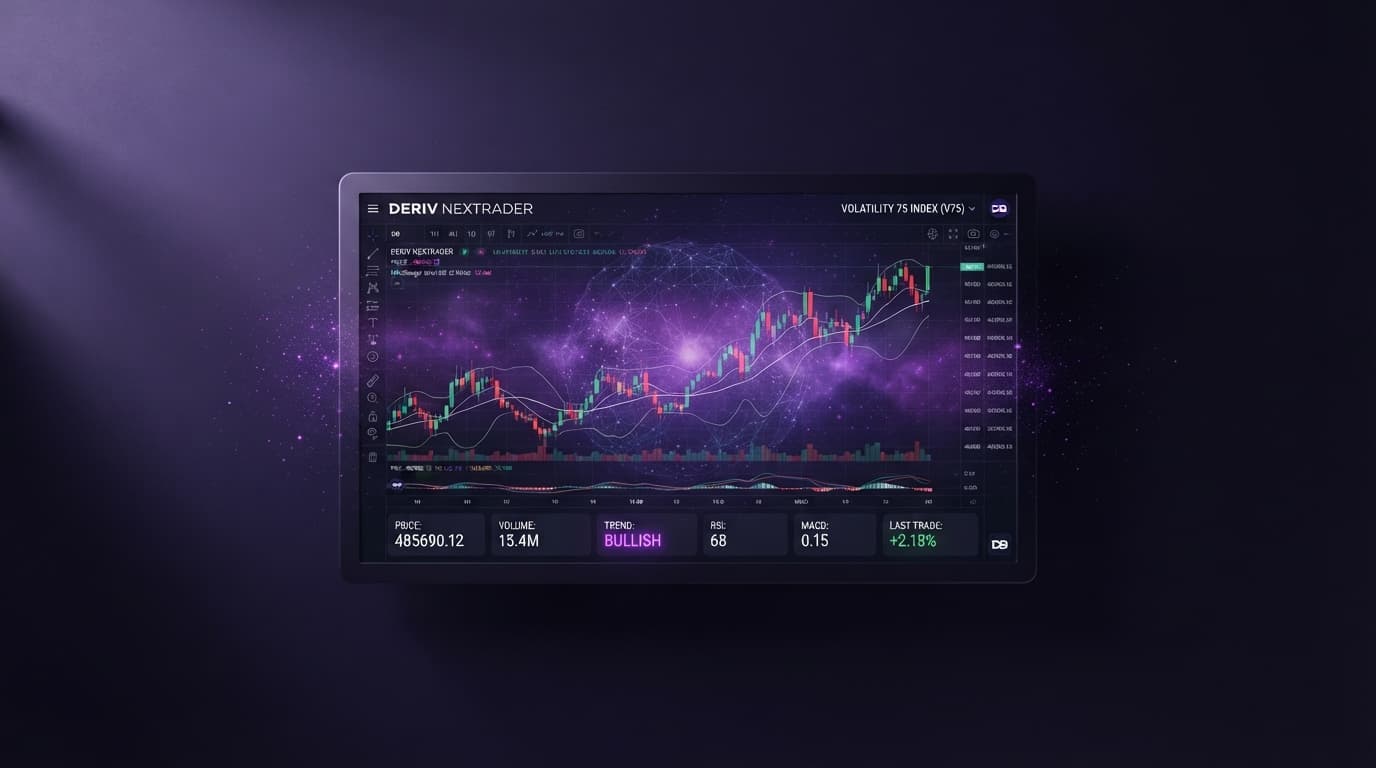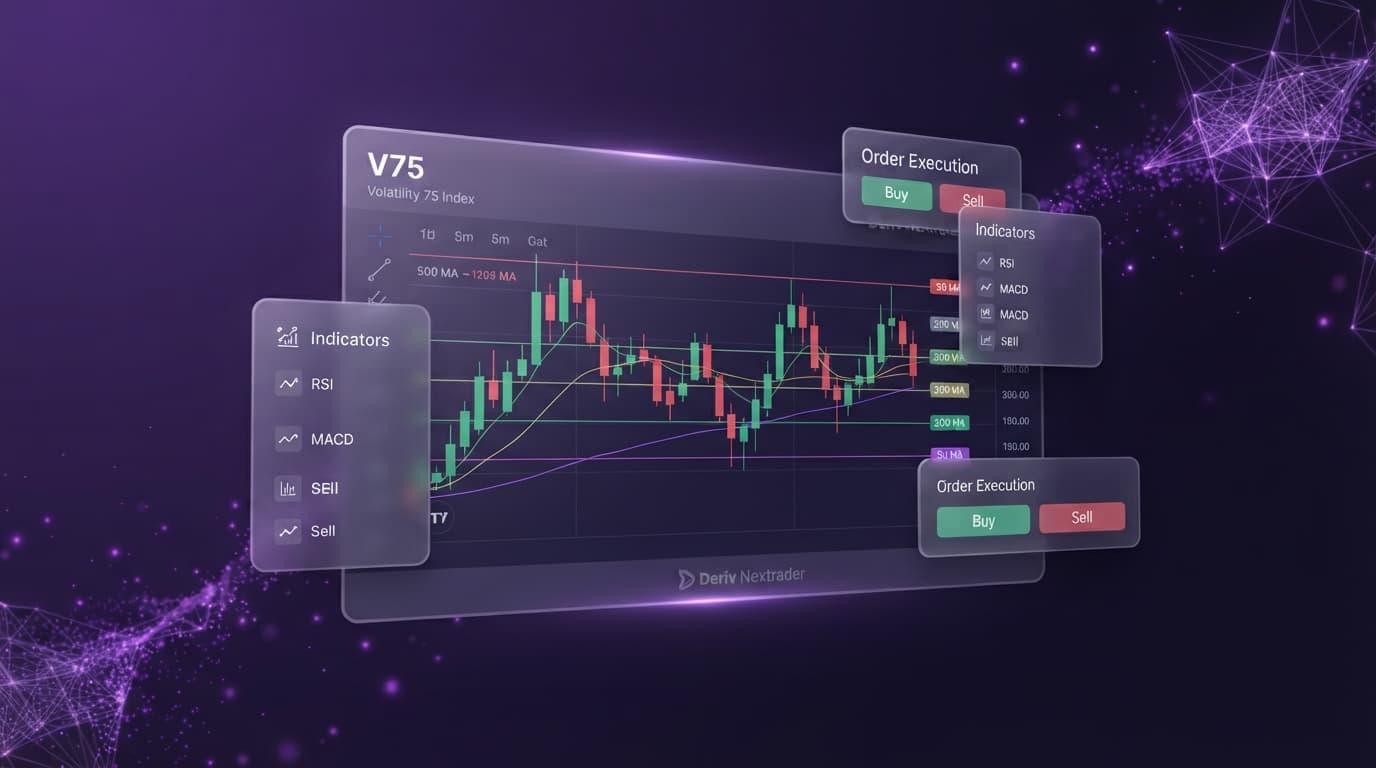
Identifying high-probability deriv candlestick patterns on fast-moving synthetic assets like the Volatility 50 (1s) Index requires an analytical workspace built specifically for high-frequency pricing streams. When analyzing synthetic reversals on NexTrader Charts, relying on isolated price bars without structural context often leads to false execution signals. By combining native drawing tools, moving averages, and key price levels on dedicated charting software, traders can systematically filter market noise and execute high-probability reversal strategies.
Using systematic deriv chart analysis on aggregated timeframes allows you to isolate genuine structural turning points from micro-tick fluctuations, ensuring every candlestick pattern you trade is backed by multi-layered confluence.
Section 1: Filtering Volatility 50 (1s) Tick Noise with 3-Minute Candles on NexTrader Charts
The Volatility 50 (1s) Index updates every single second, generating 3,600 price ticks per hour. On sub-minute timeframes like 1-second or 5-second charts, rapid algorithmic pricing creates misleading candle shapes. What appears to be a powerful bullish rejection candle on a 5-second view is often just momentary tick churn that collapses back into the trend within seconds. Trying to spot reliable deriv candlestick patterns on these micro-timeframes traps traders into entering short-term Rise/Fall positions against dominant order flow.
To analyze candlestick structures accurately, set your chart timeframe to 3 minutes inside NexTrader Charts. A 3-minute candle compresses 180 individual 1-second price ticks into a single consolidated bar. This aggregation smooths out random tick distribution while displaying true open, high, low, and close levels. On this timeframe, candle wicks signal actual structural liquidity rejection, and solid candle bodies represent sustained buying or selling imbalance necessary for pattern confirmation.
Analyze Deriv Markets Free
Pro-grade Deriv charts with 100+ indicators — RSI, MACD, Bollinger, Ichimoku. Synthetic indices, forex & crypto.
- 100+ Indicators
- Price Alerts
- All Timeframes
- Free Forever
- 1 Launch NexTrader Charts at NexTrader Charts and load the Volatility 50 (1s) Index
- 2 Switch timeframe settings from default seconds to 3-minute (3m) candle aggregation
- 3 Plot major horizontal support zones on 3m candle wicks using native line drawing tools
- 4 Overlay 20 EMA and Fibonacci retracements from our library of 100+ technical indicators
Aggregating high-density tick data into 3-minute bars preserves market volatility while giving you time to evaluate candlestick closes properly. You can verify whether a reversal pattern—such as a Bullish Engulfing or Hammer—has fully formed before calculating risk parameters or opening a position.
Section 2: Deriv Chart Analysis: Trading Deriv Candlestick Patterns at Key Support Overlays
A candlestick pattern printed in isolation carries limited statistical edge. A Bullish Engulfing pattern that forms in the middle of a tight consolidation range on Volatility 50 (1s) frequently fails because price continues churning within the zone. Effective technical analysis requires validating candle formations against confluence zones established by horizontal support levels and technical indicators on deriv charts.
Defining the 3-Minute Bullish Engulfing Setup
Unlike traditional equity or forex markets where overnight gaps regularly interrupt price continuation, Deriv synthetic indices are continuously calculated by algorithms without session closes or weekend gaps. This continuous pricing environment directly alters how deriv candlestick patterns behave:
- Gapless Open Mechanics: On traditional equity charts, a Bullish Engulfing bar usually opens with a price gap down before rallying past the previous candle's open. On continuous synthetic indices, price transitions are seamless; the 3-minute engulfing candle opens at the exact tick price where the prior red candle closed.
- Prior Bearish Candle Context: The setup begins with a clear 3-minute red candle driving lower into a pre-identified demand area, establishing the immediate short-term low.
- Full Body Coverage: Because there is no opening gap, the engulfing bar demonstrates instant buying pressure. The 3-minute green candle's real body must expand upward to fully cover the entire vertical length of the prior red candle's body, closing distinctly above the prior open.
- Direct Level Interaction: The lower shadow (wick) or opening price of the engulfing candle must make direct contact with a pre-drawn horizontal support or Fibonacci level plotted on NexTrader Charts.
Building Confluence with NexTrader Drawing Tools and Indicators
Relying solely on candle shapes is insufficient when using specialized deriv trading tools. Open NexTrader Charts and deploy a multi-layered overlay strategy to confirm structural reversals:
- Horizontal Support Zones: Select the horizontal line tool from the left toolbar. Identify previous 15-minute and 1-hour swing lows on the Volatility 50 (1s) chart and draw precise lines across these points. These levels mark key structural zones where historical liquidity absorbed selling pressure.
- Fibonacci Retracement: Draw a Fibonacci grid from the most recent major swing low to swing high on your 3-minute chart. Target the 61.8% or 78.6% retracement levels that overlap with your horizontal support lines. A 3-minute Bullish Engulfing pattern forming at this exact confluence zone provides a strong structural entry signal.
- Moving Average Baselines: Add a 20-period Exponential Moving Average (EMA) from NexTrader Charts' library of 100+ technical indicators (which includes RSI, MACD, Bollinger Bands, Moving Averages, Stochastic, Ichimoku, and Fibonacci tools). An engulfing pattern that retests an ascending 20 EMA while touching horizontal support confirms that dynamic trend support is holding firm.
When a 3-minute continuous candle engulfs the prior bar at a horizontal support line and Fibonacci level, synthetic tick noise is neutralized, leaving a fully qualified trade setup.
Section 3: Executing Rise/Fall Trades with Price Alerts and Template Saving on NexTrader Charts
Spotting a valid candlestick pattern is only effective if you execute it consistently without screen fatigue. NexTrader Charts provides native utilities designed to streamline your pattern recognition and trade preparation workflow.
Setting Custom Price Alerts for Pattern Reversal Zones
Staring at 1-second price movements 24/7 leads to overtrading and missed pattern setups. Instead of watching every candle close manually on Volatility 50 (1s), use native Price Alerts inside NexTrader Charts to notify you when price reaches key reversal zones:
- Right-click on your key horizontal support level on NexTrader Charts.
- Select "Add Alert" and set the condition to trigger when price crosses or enters your support zone.
- Configure the notification to alert you via audio or pop-up visual cue upon contact.
When the alert triggers, focus your attention on the 3-minute chart to evaluate whether the current candle closes as a valid Bullish Engulfing pattern.
Saving Custom Pattern Workspaces with Template Saving
Re-applying indicators, support lines, and chart settings every session wastes time when waiting for swift pattern completions. NexTrader Charts allows you to preserve complete analytical setups using Template Saving:
- Configure your 3-minute Volatility 50 (1s) chart with the 20 EMA overlay, Fibonacci levels, and support lines.
- Save the workspace as a named template (e.g., "V50_3M_Pattern_Setup").
- Load your template with a single click in any future session on NexTrader Charts to ensure standardized pattern analysis.
Contract Expiry Matching and Trade Execution
When the 3-minute candle closes and confirms a valid Bullish Engulfing pattern at support:
- Trade Direction: Select a Rise contract with your connected Deriv account.
- Contract Duration: Match your contract expiry directly to the 3-minute chart timeframe—setting a 3-minute duration.
- Execution Logic: Aligning contract duration with the 3-minute candle cycle gives the resulting price expansion enough time to move past minor tick fluctuations before contract expiry.
Workflow Integration and Pattern Validation
Once your trade is active or completed, capture the setup using the native Chart Screenshot & Sharing tool on NexTrader Charts. Saving annotated images allows you to build a personal log of traded candlestick patterns.
Share your chart analysis inside our official Telegram community (Telegram) to review setup execution, compare key support zones with other traders, and refine your technical approach over time.
Executing Deriv Candlestick Pattern Reversals on NexTrader Charts
Trading synthetic assets like Volatility 50 (1s) effectively requires specialized charting tools built to handle high-frequency pricing feeds. By switching to a 3-minute timeframe on NexTrader Charts, identifying continuous gapless engulfing patterns, and requiring confluence at key support zones, you remove random market noise from your decision-making.
Access professional charting and analysis tools completely free without paywalls or subscriptions at NexTrader Charts. Set up your support overlays, store your analysis templates, and join thousands of synthetic traders in our active Telegram community at Telegram.
Trading involves risk. Past performance does not guarantee future results.