Standard technical indicator defaults often produce excessive noise on continuous synthetic index feeds. When analyzing Deriv synthetic indices using NexTrader Charts (NexTrader Charts), default inputs like a 14-period RSI or 200-period EMA can generate rapid, conflicting signals due to uninterrupted tick streams that run 24/7 without market opens, closes, or weekend pauses.
Performing effective Deriv chart analysis requires tuning your indicator parameters inside NexTrader Charts to better filter rapid micro-spikes. Extending lookback windows on our free charting platform smooths out short-term algorithmic noise across trend, momentum, and volatility overlays, giving you clearer trend structure on continuous price feeds.
In this guide, we will step through the exact indicator parameters to optimize your layout for the Volatility 75 Index (V75) on a 1-minute chart inside NexTrader Charts.
The Setup
Before configuring your workspace, establish clean execution parameters. We are using NexTrader Charts to perform technical analysis on the Volatility 75 Index (V75). Synthetic volatility indices simulate market random walks but operate continuously without session opens, market closes, or weekend gaps.
Analyze Deriv Markets Free
Pro-grade Deriv charts with 100+ indicators — RSI, MACD, Bollinger, Ichimoku. Synthetic indices, forex & crypto.
- 100+ Indicators
- Price Alerts
- All Timeframes
- Free Forever
- Market: Volatility 75 Index (V75)
- Timeframe: 1-minute (1m)
- Tool: NexTrader Charts
- Strategy Goal: Capture clear trend-continuation entries while filtering micro-spike noise on continuous 24/7 synthetic ticks.
- Trade Execution Parameters: Rise/Fall synthetic contracts, $50 stake per trade setup, 1:2 risk-to-reward ratio based on support/resistance drawing tool levels.
Traditional settings designed for standard financial instruments contrast with parameters recalibrated for continuous trading feeds:
Optimizing Indicators for Deriv Synthetic Indices in NexTrader Charts
Stage 1 — Launching NexTrader Charts and Loading V75
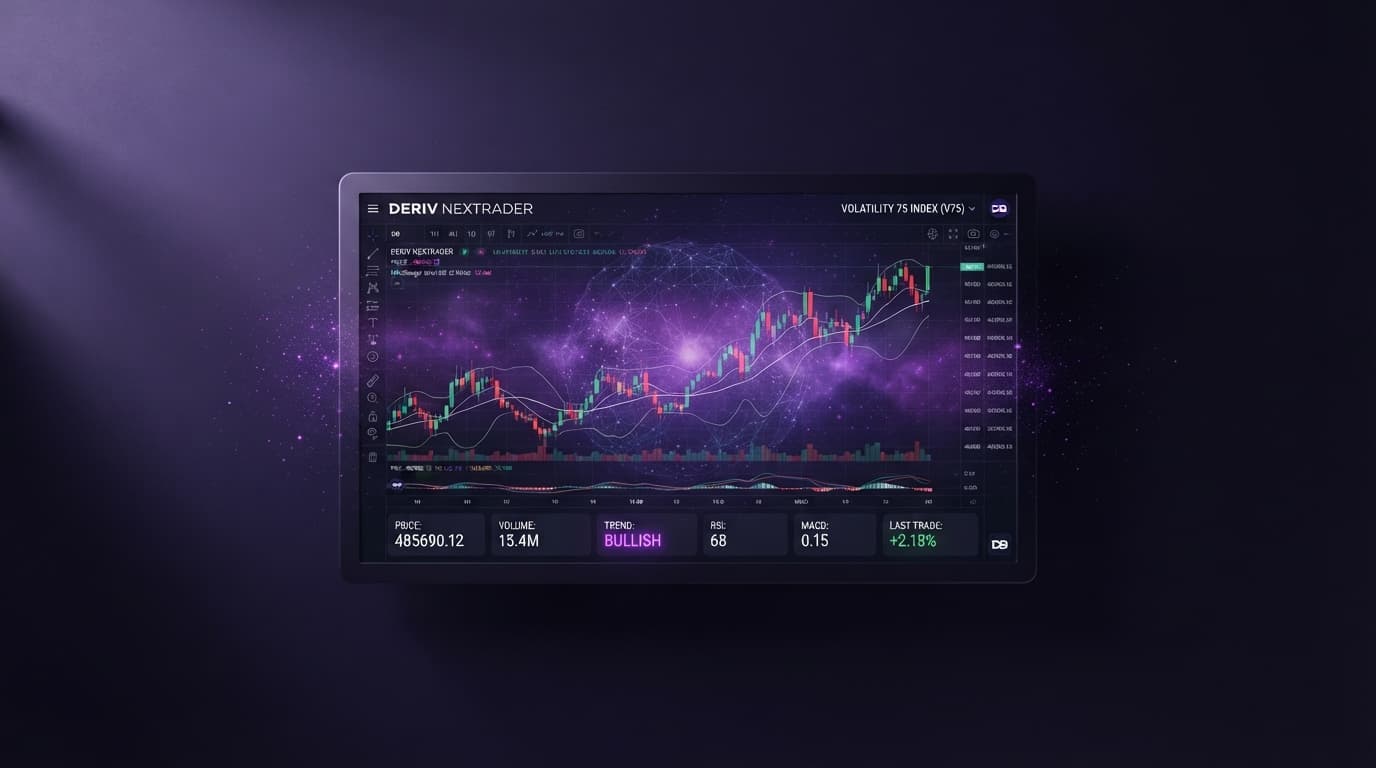
Open NexTrader Charts (NexTrader Charts) inside your web browser. From the top instrument selector dropdown, locate and click on Volatility 75 Index under the synthetic indices list. Next, set the display timeframe to 1-minute (1m) candles using the timeframe selector on the main toolbar.
Before applying any technical tools, examine the raw price action of V75 on the 1-minute chart. Deriv synthetic index price feeds generate continuous tick updates every second. On lower timeframes, this continuous frequency generates frequent micro-spikes and rapid wick extensions. Default technical overlays interpret these micro-spikes as immediate momentum shifts, leading to whipsaws.
Stage 2 — Recalibrating the Trend Layer (280 EMA)
Open the technical indicators menu on NexTrader Charts and choose Exponential Moving Average (EMA). Standard charting setups default to a 200-period lookback. On a 1-minute chart, a 200 EMA tracks 200 minutes of price history. For continuous synthetic index tick feeds, expanding this input length provides additional smoothing across rapid lower-timeframe swings.
Modify the input length in NexTrader Charts from 200 to 280 periods. On the 1m V75 chart, the extended 280 EMA smooths out random algorithm ticks, acting as a clearer dynamic support and resistance baseline during trend cycles.
Stage 3 — Adjusting Momentum Filters (21 RSI at 75/25)
Add the Relative Strength Index (RSI) from the 100+ technical indicator engine inside NexTrader Charts. A default 14-period RSI with 70/30 overbought and oversold lines fluctuates rapidly on V75, repeatedly crossing threshold bounds during basic trend pullbacks.
Change the RSI length parameter from 14 to 21. Following period expansion, adjust the overbought upper threshold to 75 and the oversold lower threshold to 25.
Expanding the RSI parameters requires V75 price action to make a stronger directional push before triggering an overbought or oversold reading. Minor tick spikes that previously registered as false momentum signals now stay within the 25–75 neutral zone.
Stage 4 — Expanding Volatility Bands (28 Period, 2.2 StdDev BB)
Select Bollinger Bands from the indicators menu on NexTrader Charts. Standard 20-period, 2.0 Standard Deviation bands struggle with synthetic index variance because V75 price spikes regularly push past 2.0 standard deviations during routine consolidation ranges.
Adjust the Bollinger Bands length to 28 periods. Next, increase the Standard Deviation multiplier from 2.0 to 2.2 inside the indicator settings.
With the 28-period / 2.2 StdDev bands active on NexTrader Charts, the outer band boundary better accommodates baseline synthetic volatility. An entry setup now requires a full 1-minute candle to close completely outside the 2.2 deviation line, helping confirm sustained directional momentum rather than an isolated tick spike.
Stage 5 — Saving the Template and Setting Real-Time Price Alerts
Now that your recalibrated suite is fully operational on NexTrader Charts, click the template management icon on the top control bar. Select "Save Template" and enter the name "V75-24/7-Suite". Saving this layout lets you instantly apply these customized indicators to V10, V25, V50, or V100 on any timeframe in future sessions.
Next, open the native price alert engine on NexTrader Charts. Select the drawing tool menu, mark your key structural support or resistance zones, and attach a real-time price alert directly to the 280 EMA support line. Whenever price touches this dynamic trend layer, an alert fires instantly. Finally, click the built-in chart screenshot button on the upper toolbar to save clean visual records of valid trade setups for your trading journal.
Execution Guidelines and Risk Management
Managing risk on continuous synthetic indices requires clear rules around price consolidation and indicator alignment. Even with recalibrated indicators on NexTrader Charts, synthetic index price action regularly enters tight sideways ranges where dynamic indicators flatten out.
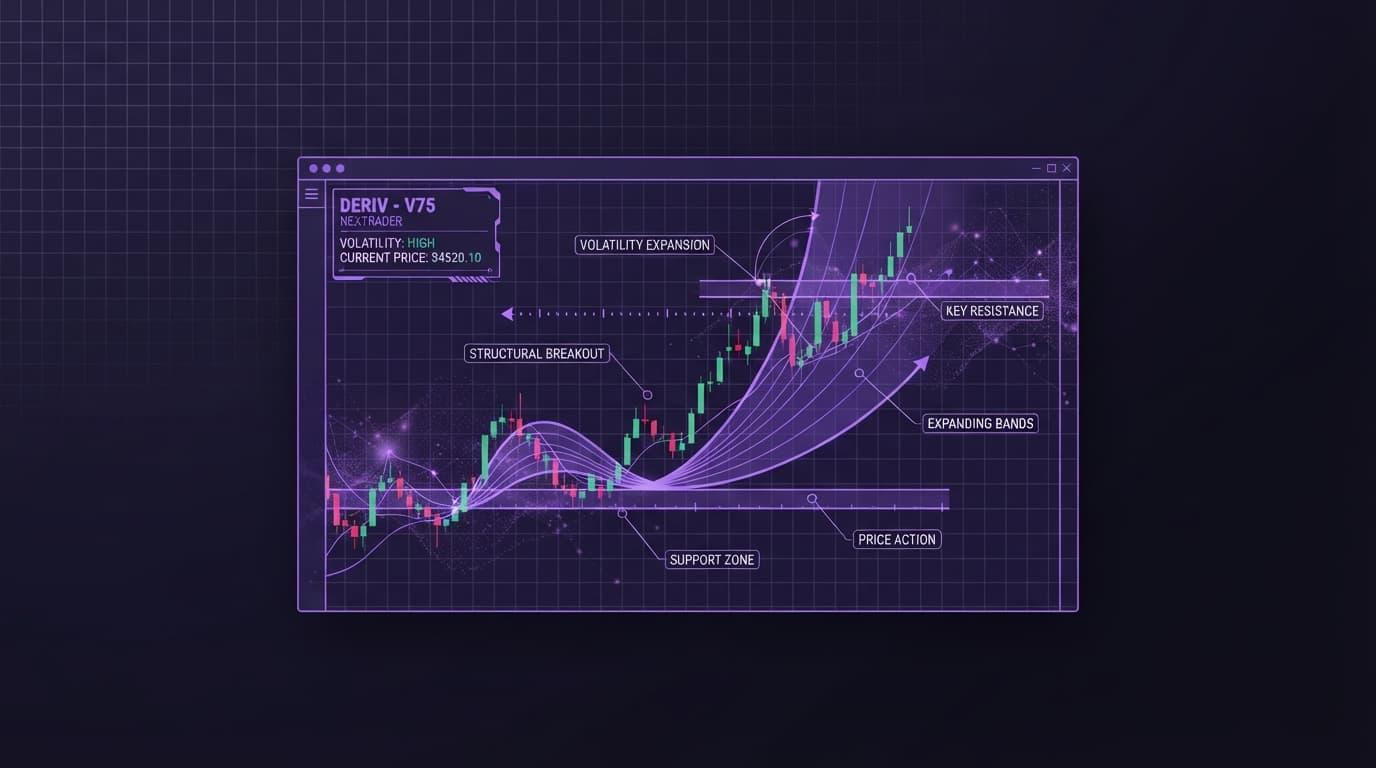
During horizontal consolidation phases, Bollinger Bands contract and price candles repeatedly cross the 280 EMA line. Entering Rise/Fall setups inside narrow ranges increases exposure to unexpected tick spikes. Wait until price breaks cleanly out of the compressed 2.2 standard deviation bands and confirms direction with a candle close above dynamic support or resistance.
When analyzing V75 on a 1-minute timeframe inside NexTrader Charts, use the horizontal line drawing tools to map structure before committing capital. Pair your dynamic 280 EMA trend filter with active support and resistance zones, maintaining a minimum 1:2 risk-to-reward ratio on every planned trade setup.
Do This Yourself
Follow this step-by-step implementation checklist to recalibrate your analysis layout:
- Go to NexTrader Charts at NexTrader Charts in your desktop or mobile browser.
- Open the asset selector menu and select any synthetic index (V10, V25, V50, V75, or V100).
- Switch your chart timeframe selector to 1-minute (1m).
- Select technical indicators and add Exponential Moving Average (EMA). Set the length input period to 280.
- Add Relative Strength Index (RSI). Set period length to 21, overbought upper line to 75, and oversold lower line to 25.
- Add Bollinger Bands. Set length period to 28 and Standard Deviation to 2.2.
- Use the support and resistance drawing tools to outline active key market levels, and set a real-time price alert on the 280 EMA touchpoint.
- Click "Save Template" and name your configuration "V75-24/7-Suite" so your custom settings load instantly inside NexTrader Charts during future sessions.
Start Now
Applying default indicator settings to 24/7 synthetic markets often leads to over-trading on minor price spikes. Adjusting indicator lookbacks and deviation thresholds inside NexTrader Charts helps smooth out chart presentation and provides clearer visual reference points for your trading strategy.
Launch NexTrader Charts (NexTrader Charts) to configure, test, and save your custom indicator suites for Deriv synthetic indices today. Create your free account at Sign Up Free — Nextrader to access our complete ecosystem. Join our Telegram community at Telegram to exchange template configurations and discuss market setups with other traders.
Trading involves risk. Past performance does not guarantee future results.