Mastering how to analyze deriv market conditions requires eliminating subjective guessing in favor of a repeatable, quantitative methodology. This guide walks through a complete six-step analysis system running directly on NexTrader Charts, combining trend mapping, volatility profiling, structural confluence, real-time alerts, template management, and lower-timeframe entry execution.
Analyzing synthetic assets like the Volatility 75 Index (V75) or Volatility 100 (1s) Index (V100 1Hz) demands precise visual clarity. Utilizing NexTrader Charts and its essential deriv trading tools allows traders to isolate structural shifts and manage risk without relying on delayed platform indicators.
By establishing structured technical workflows on NexTrader Charts, you build an objective framework designed for 24/7 synthetic indices, forex, and commodities.
- 1 Macro Trend Mapping on H1 (50/200 EMA)
- 2 Volatility Profiling on M15 (ATR 14 Expansion)
- 3 Confluence Marking (Fibonacci Golden Pocket)
- 4 Alert Execution Setup on Active Levels
- 5 Template Saving for Multi-Asset Scanning
- 6 Entry Execution on M1/M5 RSI Divergence
Step 1: How to Analyze Deriv Market Structure on H1 Timeframes
Effective deriv chart analysis begins by isolating macro direction on the 1-Hour (H1) timeframe. Synthetic indices generate continuous tick data generated by cryptographic algorithms, meaning high-timeframe structural levels hold significant weight.
Analyze Deriv Markets Free
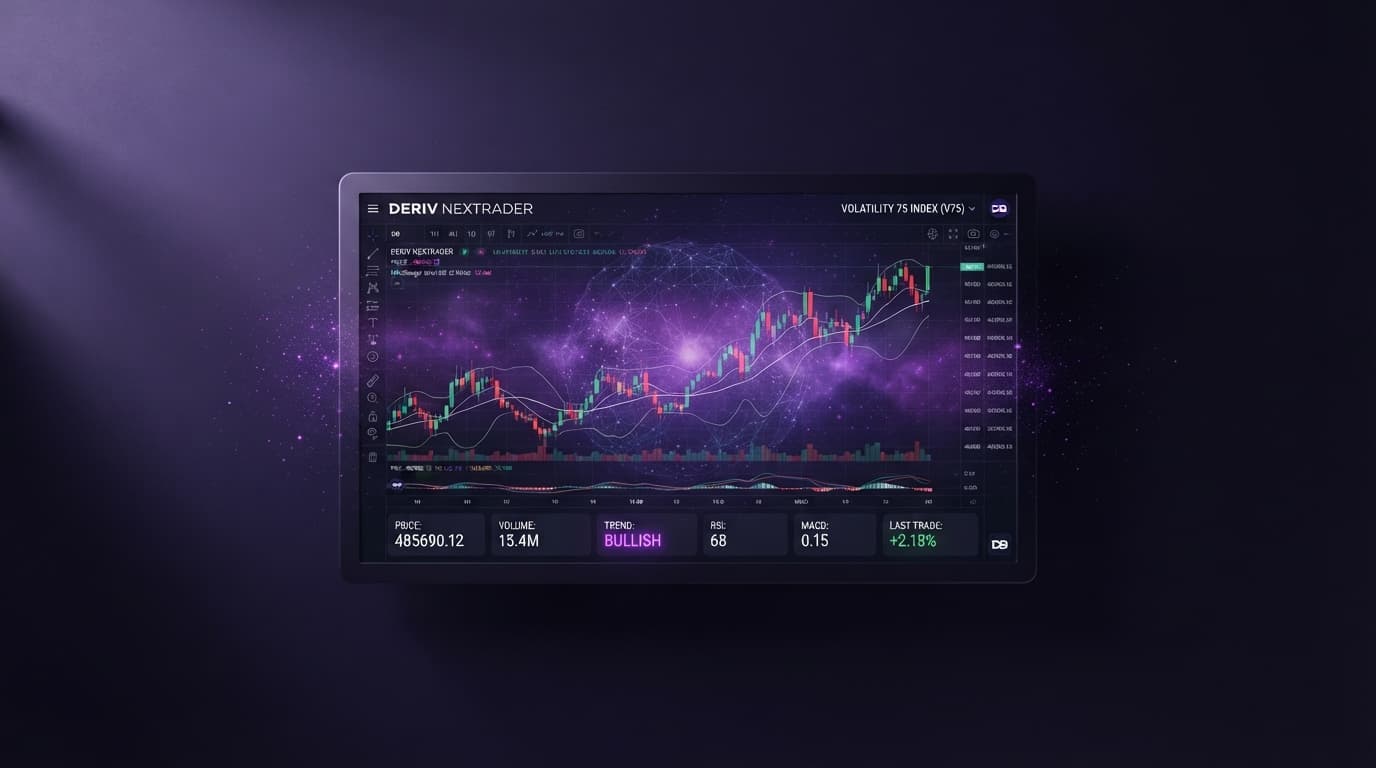
Pro-grade Deriv charts with 100+ indicators — RSI, MACD, Bollinger, Ichimoku. Synthetic indices, forex & crypto.
- 100+ Indicators
- Price Alerts
- All Timeframes
- Free Forever
- Navigate to NexTrader Charts in your browser.
- Select Volatility 75 Index (V75) from the asset selector located at the top-left of the chart canvas.
- Adjust your timeframe to 1 Hour (H1) using the timeframe navigation bar at the top of the interface.
- Click the Indicators button on the top toolbar, search for Moving Average Exponential, and select it twice to load two exponential moving averages onto your canvas.
- Access the settings cog for the first EMA: set the Length to
50, change the visual style color to Blue, and click OK. - Access the settings cog for the second EMA: set the Length to
200, change the visual style color to Orange, and click OK. - Open the drawing toolbar on the left side of the chart and select the Trendline Tool.
- Draw trendlines connecting consecutive swing highs or swing lows across the H1 canvas to define structural boundary lines. Track where the 50 EMA sits relative to the 200 EMA to identify higher-timeframe alignment before dropping down to intermediate timeframes.
Step 2: Quantify Volatility Regimes Using ATR (14) on M15
Once high-timeframe bias is established, shift focus to intermediate market dynamics to evaluate market volatility expansion versus contraction. Executing trades during low-volatility consolidation leads to choppy drawdowns, while trading during volatility expansion offers clean directional movement.
- Change the chart timeframe from H1 to 15 Minutes (M15) on the top bar of NexTrader Charts.
- Open the Indicators menu, search for Average True Range (ATR), and add it to your chart canvas.
- Open the ATR indicator settings menu and verify the Period Length is set to
14. - Examine the numerical output value of the 14-period ATR reading on the M15 panel.
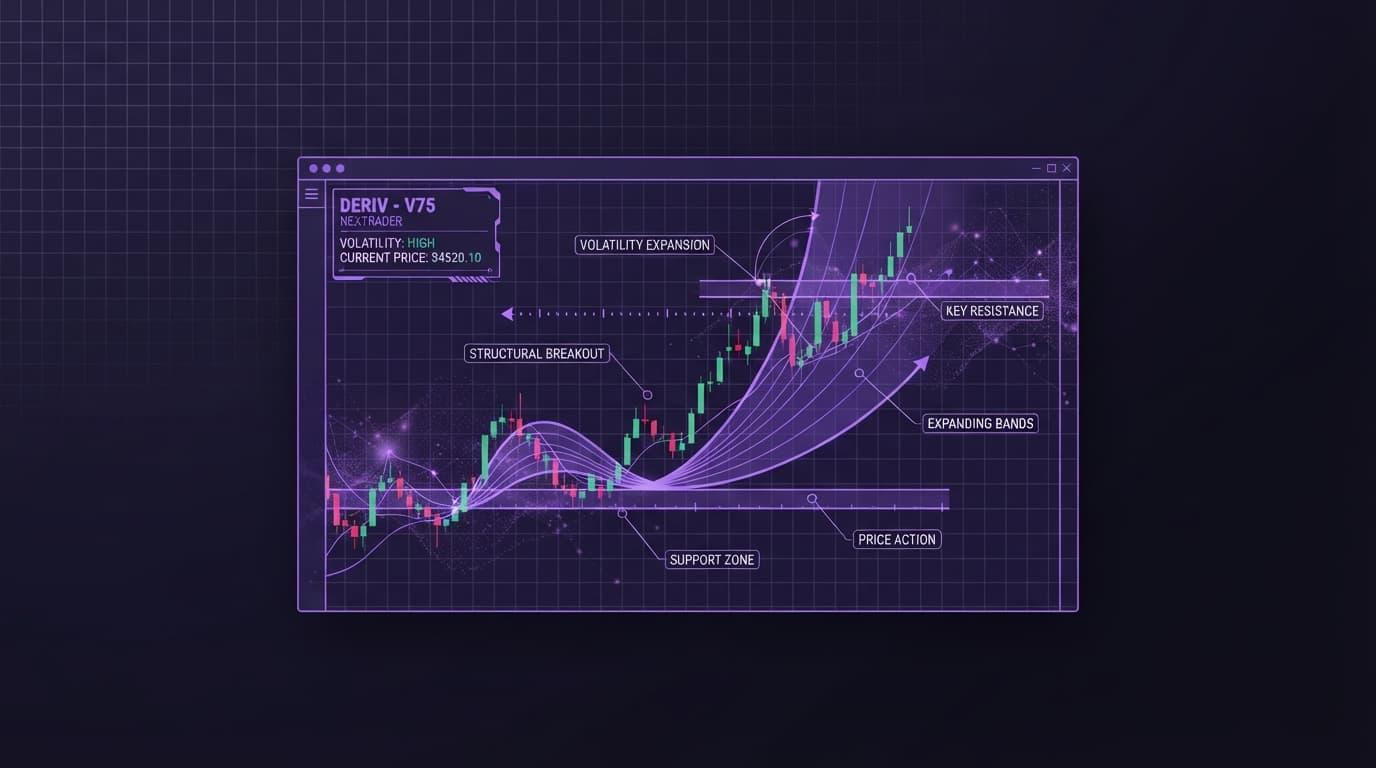
When the ATR line slopes upward and prints values above its recent baseline, the market indicates active Volatility Expansion. In this regime, momentum strategies and breakout entries align with broader market expansion. When the ATR line trends downward toward multi-session lows, the asset enters Volatility Contraction, signaling tight ranges.
Use this exact ATR value to set objective risk parameters. For the Volatility 75 Index on M15, calculate your minimum stop-loss distance as 1.5 x Current ATR Value. For example, if the M15 ATR displays 1200.00 points, set your stop-loss buffer no closer than 1800.00 ticks from your execution point to handle normal market fluctuations.
Step 3: Draw Confluence Zones with Fibonacci and Support/Resistance Tools
With directional bias confirmed on H1 and volatility validated on M15, the next phase of technical analysis requires isolating high-probability reversal zones. Combining mathematical Fibonacci ratios with visual structural blocks creates precise confluence zones on NexTrader Charts.
- Identify the most recent significant impulse wave on your M15 chart that aligns with your H1 trend direction.
- Select the Fibonacci Retracement Tool from the left-hand drawing menu.
- For an established uptrend, click the swing low at the origin of the impulse wave and drag the tool upward to the absolute swing high peak. For a downtrend, click the swing high origin and drag down to the swing low trough.
- Open the Fibonacci settings panel and ensure the key golden ratio levels are visible: 0.618 and 0.786 (the Golden Pocket). Uncheck unnecessary secondary levels to keep your canvas uncluttered.
- Select the Rectangle Tool from the left drawing toolbar.
- Highlight the horizontal zone spanning between the 0.618 and 0.786 Fibonacci levels where they intersect historical H1 support/resistance structural pivots.
This shaded block represents your High-Confluence Buy/Sell Zone. Rather than placing blind limit orders into the market, wait for price action to test this zone before seeking lower-timeframe execution triggers.
Step 4: Configure Real-Time Price Alerts on NexTrader Charts
To trade synthetic markets efficiently without spending hours staring at candle movements, configure native price alerts directly inside NexTrader Charts.
- Hover your cursor over the exact price level marking the outer boundary of your drawn Fibonacci Rectangle confluence zone.
- Right-click on the price line or structural drawing block on your chart canvas.
- Select Add Alert from the context dropdown menu.
- In the alert configuration window, set the Condition trigger to Crossing.
- Set the Action trigger to alert you upon Once Per Bar Close to filter out temporary wick spikes.
- Select sound notifications and visual pop-up banners, then click Create.
Your alert is now actively monitored by the NexTrader Charts system engine. NexTrader Charts will sound an immediate notification the moment price crosses your high-confluence level.
Step 5: Save Your Technical Analysis Template
Saving your configured layout as a custom analysis template on NexTrader Charts streamlines daily routines across multiple synthetic assets.
- Navigate to the top toolbar on NexTrader Charts and locate the Template / Chart Layout menu icon.
- Click Save Chart Layout from the dropdown options.
- Type
Deriv 6-Step Structural Templateinto the layout name field and press Save. - Test your new template by switching from Volatility 75 Index to Volatility 100 Index (V100 1Hz) or Boom 1000 Index via the asset dropdown.
Your 50/200 EMAs, ATR (14) setup, visual settings, and preferred color palettes will load instantly onto the new asset, allowing you to scan dozens of deriv charts in seconds.
Step 6: Refine Entry Confirmation on M1/M5 Execution Charts
When your real-time price alert sounds on NexTrader Charts, transition to the execution phase on lower timeframes.
- Switch your timeframe from M15 down to 5 Minutes (M5) or 1 Minute (M1) on NexTrader Charts.
- Open the Indicators menu and add the Relative Strength Index (RSI) with a standard Length of
14. - Confirm that the upper band is set to
70(Overbought) and the lower band is set to30(Oversold). - Observe price action as it trades inside your H1/M15 marked rectangle confluence zone.
- Look for RSI Divergence: if price makes a lower low inside the zone on M1 while the RSI line makes a higher low (or vice versa for shorts), this signals a potential reversal trigger.
- Execute the trade contract on your Deriv broker account, placing your stop-loss safely outside the ATR buffer defined in Step 2.
If Something Goes Wrong
- Price Alerts Not Triggering: Check that web browser notification permissions are explicitly set to Allow for NexTrader Charts. Additionally, confirm that the alert condition target price was not set past current price action or placed inside an already-closed candle bar.
- Chart Layouts or Drawing Tools Not Persisting: Ensure your browser is not automatically clearing local cache storage upon closing. Always confirm you manually clicked Save Chart Layout under the top workspace menu on NexTrader Charts before closing your session window.
- Indicators Displaying Incorrect Values: Verify that synthetic market data feeds are active. If trading Volatility 100 (1s), refresh the canvas on NexTrader Charts to re-establish the real-time WebSocket stream.
Elevate your technical precision across all Deriv markets today. Access live professional charting, apply structural indicators, and set real-time price alerts completely free on NexTrader Charts. To unlock market signals, connect your workflow, or build customized automated systems, create your free account on NexTrader App and join our active trading group on Telegram.
Trading involves risk. Past performance does not guarantee future results.