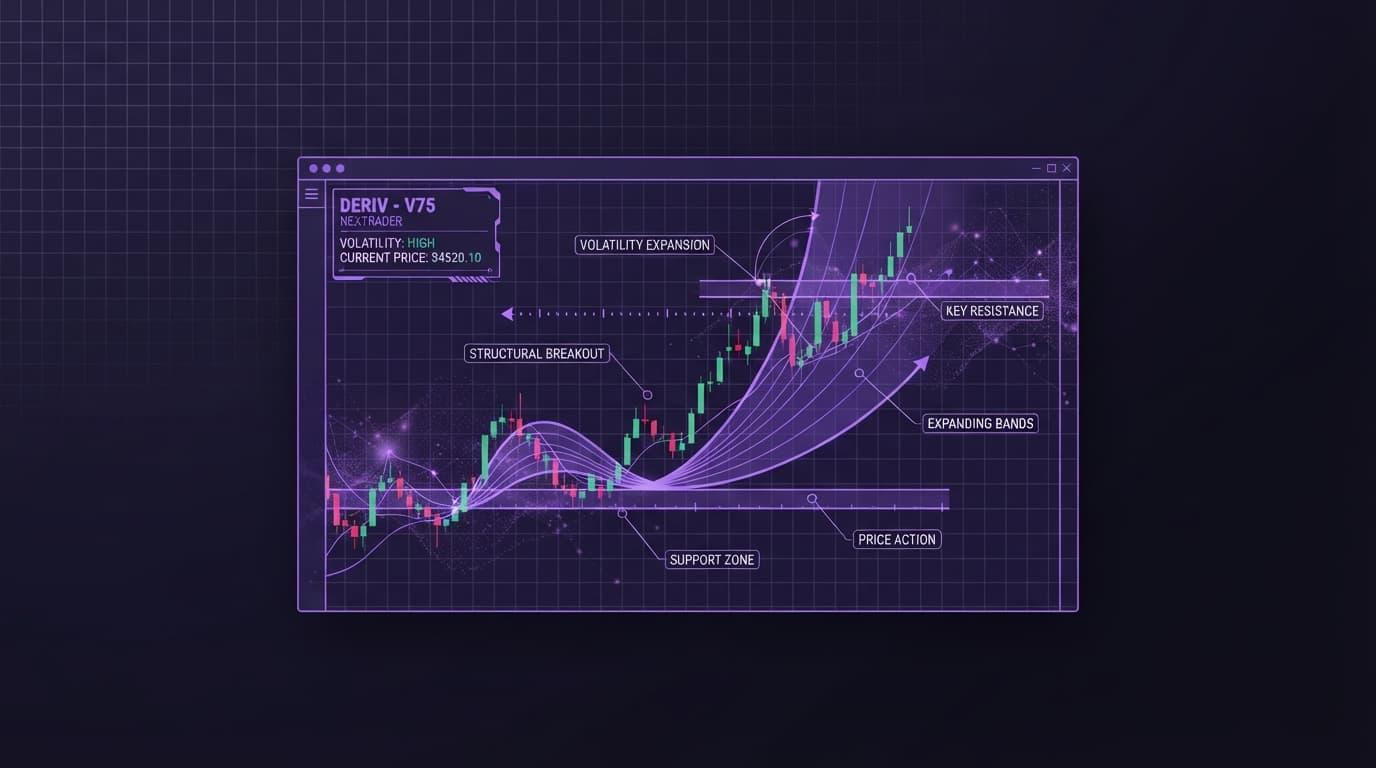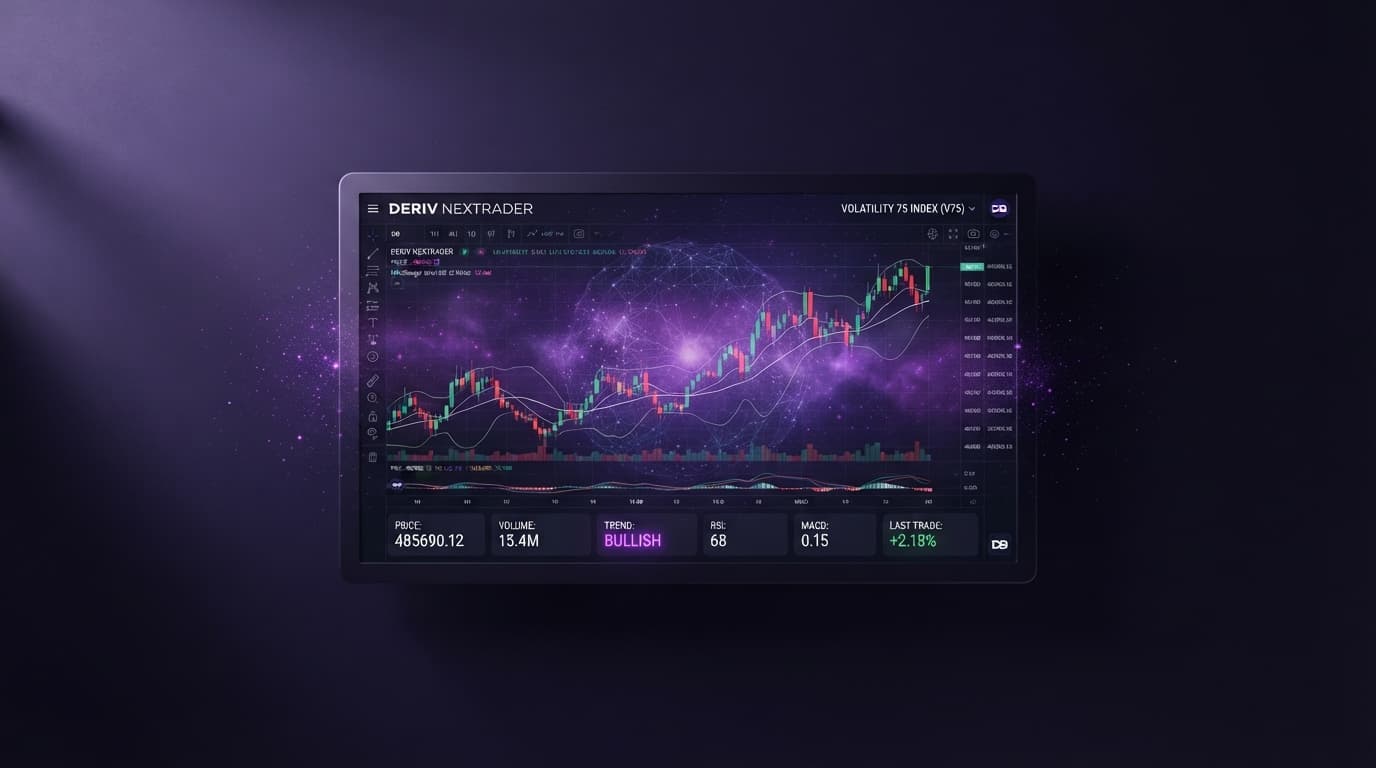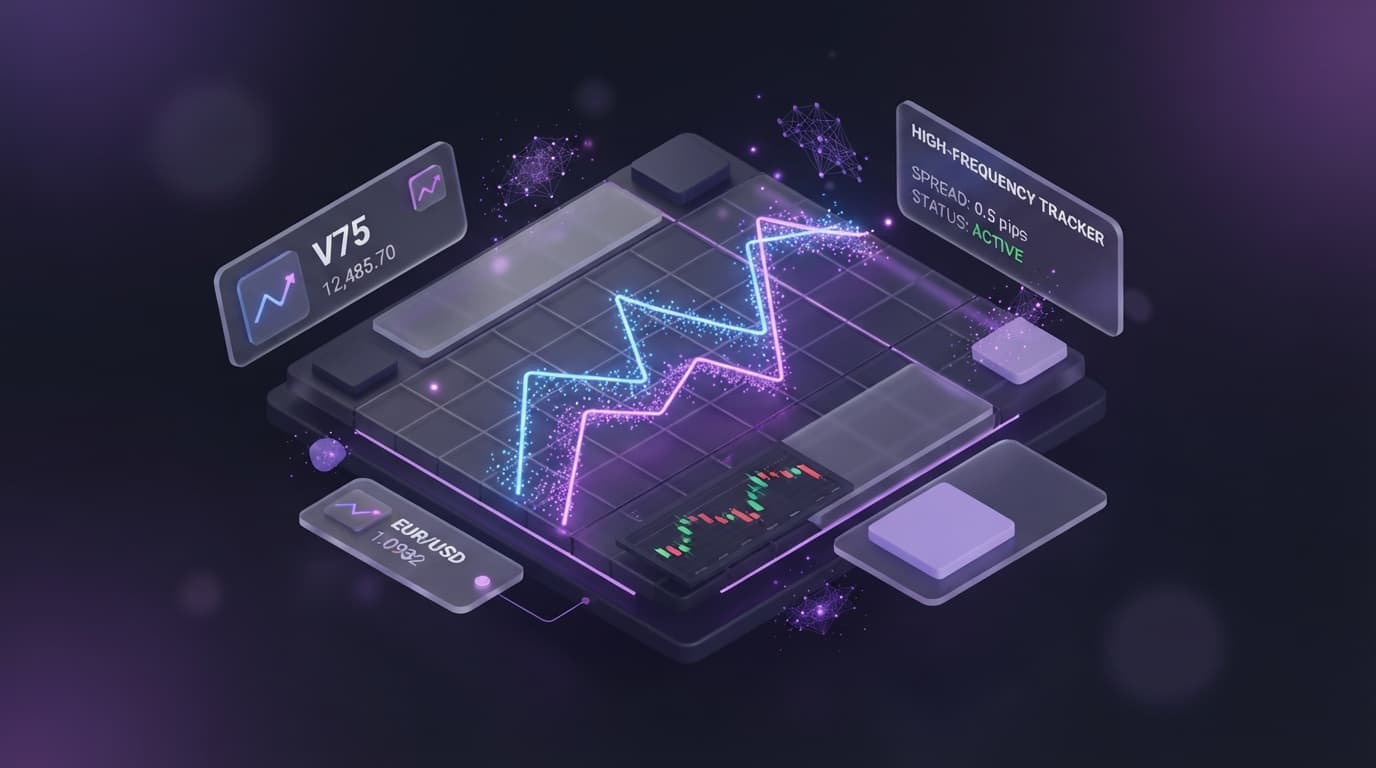
Finding reliable free deriv charting software without paywalls or laggy multi-chart layouts often leaves traders struggling with obscured micro-second price action. High-speed markets like Volatility 75 (V75) move too quickly for fragmented setups.
The Volatility 75 Index and its faster-tick counterpart, Volatility 75 (1s), generate continuous, 24/7 price feeds built on cryptographic algorithms. Because V75 (1s) recalculates every single second while standard V75 updates on a regular tick frequency, subtle lead-lag price divergences frequently appear on lower timeframes. Capitalizing on these micro-divergences requires real-time side-by-side analysis without constant tab switching or paying monthly software fees.
NexTrader Charts resolves this bottleneck by offering professional charting capabilities built on direct WebSocket API connections to Deriv market streams. Through native chart comparison tools, flexible indicator overlays, and instant price alerts, traders can construct a high-performance lead-lag analysis engine completely free of charge.
What This Fixes: Lag and Paywalls in Deriv Chart Analysis
Managing volatile synthetic markets across multiple single-asset browser tabs creates execution friction. When you switch back and forth between standard V75 and V75 (1s), your visual processing delays entry signals. A lead-lag divergence—where the 1-second index moves first while the standard index lags behind—lasts only a few seconds on a 1-minute chart. Manual tab switching guarantees you see the move after it has already occurred.
Analyze Deriv Markets Free
Pro-grade Deriv charts with 100+ indicators — RSI, MACD, Bollinger, Ichimoku. Synthetic indices, forex & crypto.
- 100+ Indicators
- Price Alerts
- All Timeframes
- Free Forever
Traditional external mapping tools often require paid monthly tiers to unlock multi-chart layouts or custom overlay capabilities on live WebSockets. NexTrader Charts provides professional NexTrader Charts features with 100+ technical indicators, drawing tools, and comparison panels built directly into the core platform at zero cost. By consolidating both price feeds into a unified workspace, you eliminate screen fragmentation, prevent missed entry signals, and maintain uninterrupted situational awareness.
Quick Setup Check for Free Deriv Charting Software
Before configuring your lead-lag comparison workspace, ensure your charting environment meets the technical prerequisites for streaming high-frequency tick data.
- 1 Open NexTrader Charts in an active WebSocket browser window
- 2 Select Volatility 75 Index as your anchor asset
- 3 Set timeframe resolution to 1-minute (1m)
- 4 Launch the native Chart Comparison tool and add Volatility 75 (1s) Index
Confirm that the WebSocket connection status indicator shows active live data streaming. Because synthetic indices run 24/7, continuous tick feeds should populate instantly across both instruments without data gaps or delayed candle formation.
Fix 1: Syncing Volatility 75 and Volatility 75 (1s) via Chart Comparison
- Symptom: Inability to track micro-second price action leads between V75 and V75 (1s) on a single market view, leading to mismatched directional bias.
- Why it happens: Single-asset charts hide short-term tick lead-lag differences across varying calculation frequencies. The Volatility 75 (1s) Index processes a price tick every single second (1Hz generation speed), whereas standard Volatility 75 processes ticks at standard intervals. During momentum surges, V75 (1s) frequently expands ahead of standard V75.
- Exactly what to change: Launch NexTrader Charts and open the Volatility 75 Index as your base asset. Click the "Compare" or "Add Symbol" tool on the top toolbar. Type in
Volatility 75 (1s) Indexand select the overlay option to display both price series on the primary panel. This places both price lines directly on top of each other, allowing you to visually detect when V75 (1s) breaks away from standard V75 price paths.
Fix 2: Standardizing Indicator Overlays Across 1-Minute Timeframes
- Symptom: False divergence signals caused by unmatched indicator periods, mismatched scale settings, or inconsistent timeframe scales across compared assets.
- Why it happens: When secondary comparison overlays use different time scales or non-aligned technical settings, indicators calculate offset values. A momentum spike on a 1-minute feed compared against a 5-minute metric produces visual distortion, encouraging premature trade entries.
- Exactly what to change: Set both primary and comparative series to a 1-minute (1m) chart timeframe inside NexTrader Charts. Open the indicators menu and apply a Relative Strength Index (14-period RSI) configured with 70 overbought and 30 oversold thresholds. Next, add a 20-period Moving Average (20 MA) directly to the price feed. Ensure both the primary V75 stream and the comparative V75 (1s) overlay calculate these exact technical metrics. Unifying your technical analysis parameters across both assets guarantees that oscillator extremes reflect true market expansion rather than settings mismatch.
Fix 3: Identifying and Confirming Lead-Lag Divergence Thresholds
- Symptom: Entering trades prematurely during false breakouts before the lagging instrument reacts, leading to unnecessary stop-outs.
- Why it happens: Traders mistake brief tick noise for structural lead-lag shifts. A single tick push on V75 (1s) does not automatically guarantee that standard V75 will follow unless key technical levels are breached simultaneously with momentum confirmation.
- Exactly what to change: Use the horizontal drawing tools on NexTrader Charts to plot explicit support and resistance zones across recent 1-minute swing highs and lows. Monitor the live tick correlation. When V75 (1s) aggressively crosses the 20-period Moving Average or pushes its 14-period RSI beyond the 70/30 boundaries while standard V75 remains consolidated inside the support/resistance range, a lead-lag divergence is confirmed. Wait for V75 (1s) to break the immediate price structure; this gives you a high-probability catch-up setup on the lagging standard V75 instrument before it catches up to the movement.
Fix 4: Locking Your Workspace with Custom Price Alerts and Template Saving
- Symptom: Redoing multi-asset layout configurations, comparative overlays, and technical indicator settings every time you open a new trading session.
- Why it happens: Unsaved chart configurations clear when your session reloads or the browser cache refreshes, costing valuable time and disrupting your daily analysis routines.
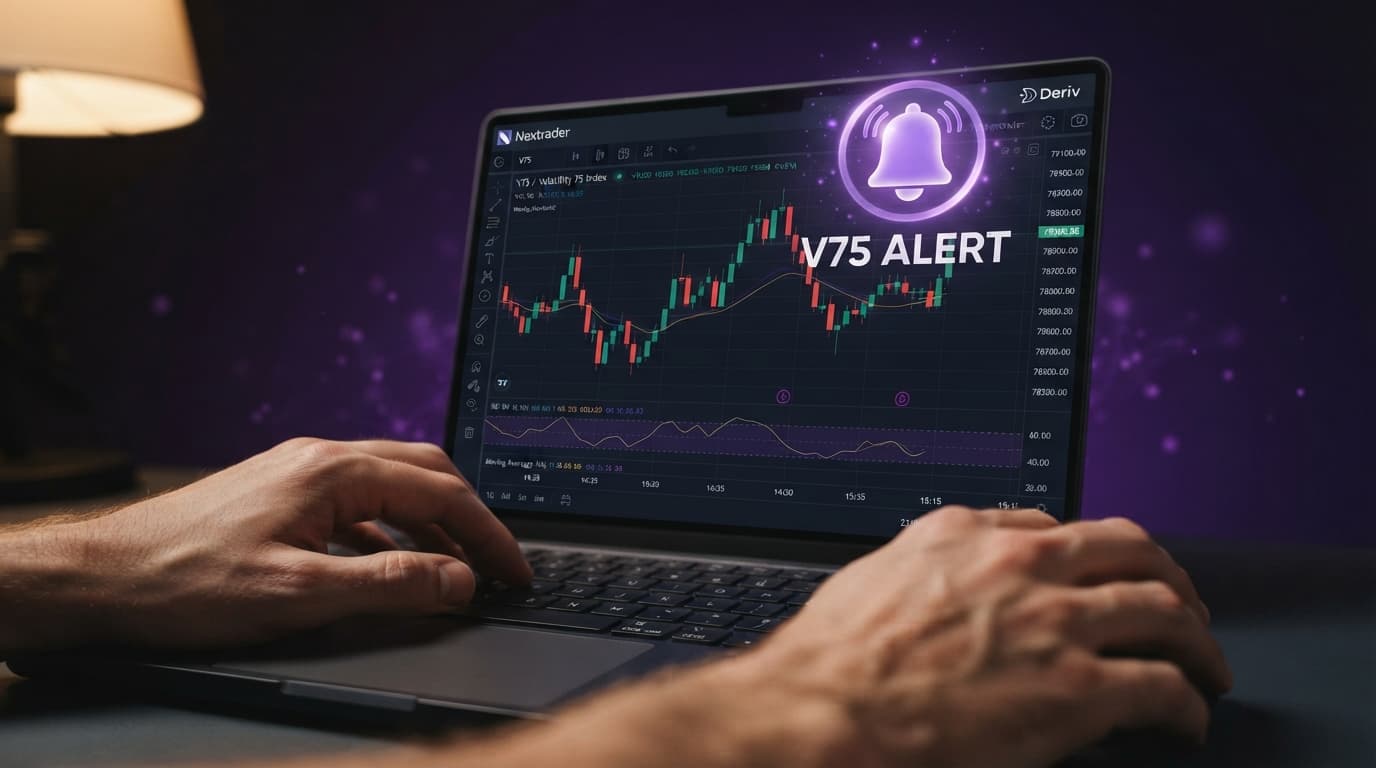
- Exactly what to change: Once your 1-minute V75/V75 (1s) workspace, 20 MA, 14 RSI, and support/resistance levels are fully aligned on NexTrader Charts, click "Save Template" on the main toolbar. Assign a dedicated name such as "V75 Lead-Lag Divergence". Next, right-click your key horizontal support/resistance levels and select "Set Price Alert". Program custom alerts to trigger when price action approaches breakout thresholds. This allows you to monitor market conditions passively without staring at ticks continuously, preserving your execution focus until high-probability setup conditions are fully met.
Keeping It Stable
Maintaining a high-speed multi-chart setup requires optimizing your workspace efficiency and keeping data streams stable:
- Deriv WebSocket API Stream Optimization: NexTrader Charts connects directly to Deriv WebSocket market feeds, maintaining real-time 1Hz tick streaming across V75 and V75 (1s) without bandwidth bottlenecks or data drops.
- Ecosystem Tool Integration: Utilize the broader Nextrader ecosystem (
nextrader.live) for complementary deriv trading tools, featuring native BinaryBot XML support and direct API connectivity designed for Deriv synthetics. - Community Technical Collaboration: Compare multi-chart settings and refine 1-minute lead-lag parameters alongside active traders in the official Telegram community (
Telegram).
Start Now: Optimize Your Deriv Trading Tools Strategy
- Launch your 100% free multi-chart setup right now at NexTrader Charts.
- Create your free Nextrader account at NexTrader Registration to unlock full ecosystem tools.
- Connect with active synthetic index traders in our official Telegram community at Telegram.
Trading involves risk. Past performance does not guarantee future results.