5 Quick Tips for Confirming Deriv Synthetic Index Trends Using Multiple Timeframes and Moving Averages on NexTrader Charts
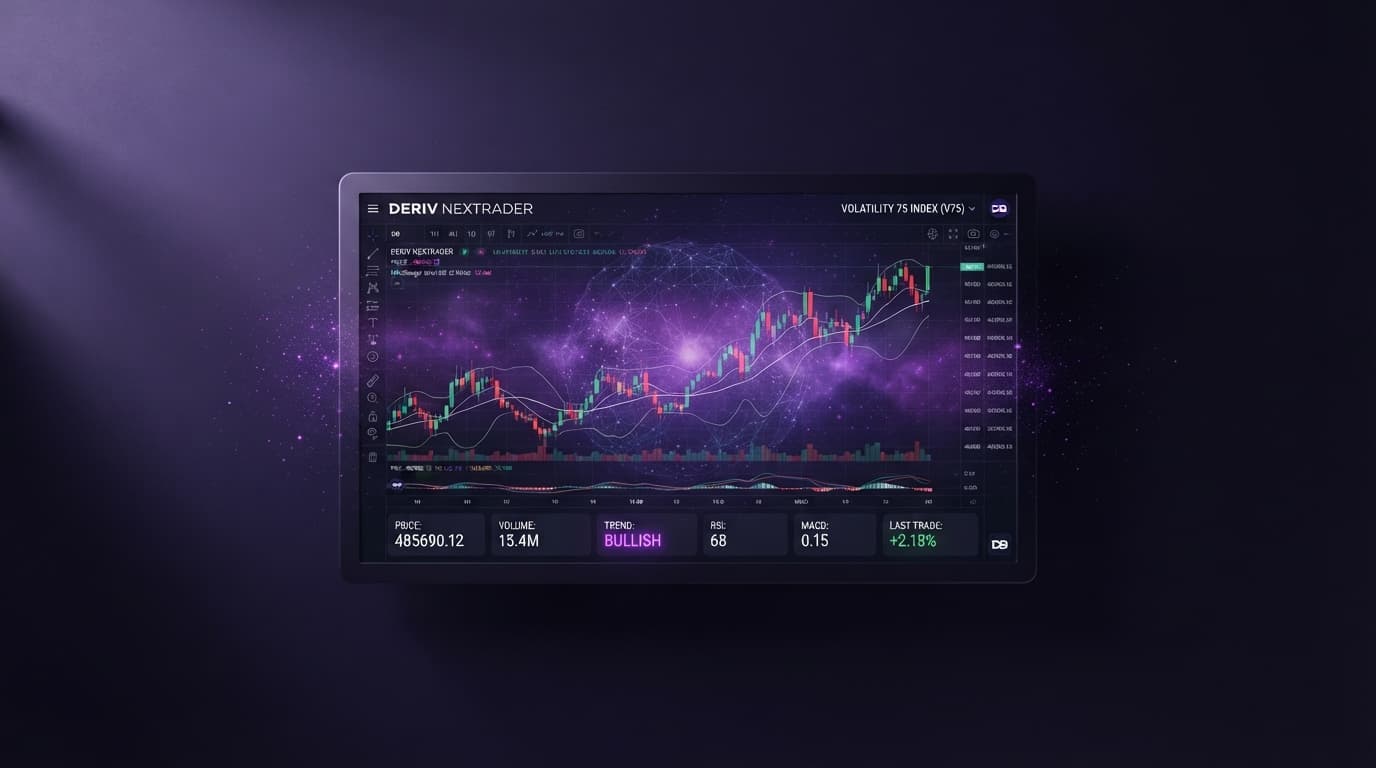
Navigating the dynamic world of Deriv Synthetic Indices requires a robust approach to trend identification. While these instruments offer 24/7 trading opportunities, discerning genuine trends from mere market noise can be challenging. This is where the power of comprehensive deriv chart analysis comes into play, specifically leveraging multiple timeframes and Moving Averages. Fortunately, NexTrader Charts provides professional, free deriv charts with all the advanced technical analysis tools you need.
Understanding the underlying trend is paramount for any successful trading strategy. By combining different time perspectives with a versatile indicator like the Moving Average, you can gain a clearer, more confirmed view of market direction. NexTrader Charts equips you with over 100 technical indicators, including various Moving Average types, and timeframes from 1-minute to monthly, making it the ideal platform for this multi-faceted analysis.
This guide will walk you through five quick, actionable tips to confirm trends in instruments like VIX, Boom, and Crash indices using these powerful techniques, all accessible through your free NexTrader Charts account. These methods help filter out false signals and improve your decision-making.
Tip 1: Start with the Higher Timeframe for the Overall Bias
Always begin your deriv chart analysis on a higher timeframe, such as the Daily or 4-hour chart. This provides the "big picture" trend direction, helping you avoid trading against the prevailing market sentiment. If the 4-hour chart shows an uptrend (price making higher highs and higher lows, with Moving Averages sloping upwards), then you should primarily look for long opportunities on lower timeframes. Use a long-period Moving Average (e.g., 200 SMA) on NexTrader Charts to quickly gauge this overarching direction.
Analyze Deriv Markets Free
Pro-grade Deriv charts with 100+ indicators — RSI, MACD, Bollinger, Ichimoku. Synthetic indices, forex & crypto.
- 100+ Indicators
- Price Alerts
- All Timeframes
- Free Forever
Tip 2: Confirm Entry/Exit on Lower Timeframes Aligned with the Higher Trend
Once you've identified the higher timeframe trend, drop down to a lower timeframe (e.g., 15-minute or 5-minute) for precise entry and exit points. For instance, if the 4-hour chart shows an uptrend, wait for pullbacks to a short-period Moving Average (e.g., 20 SMA or 50 EMA) on the 15-minute chart. A bounce off this MA, along with a bullish candlestick pattern, can serve as a strong confirmation for a long entry, ensuring your trade aligns with the dominant trend.
Tip 3: Utilize Moving Average Crossovers for Trend Confirmation
Moving Average crossovers are classic trend confirmation signals. On NexTrader Charts, apply two different Moving Averages, such as a 50-period Simple Moving Average (SMA) and a 200-period SMA. A "Golden Cross" (50 SMA crossing above 200 SMA) indicates a potential bullish trend shift, while a "Death Cross" (50 SMA crossing below 200 SMA) signals a bearish shift. Confirm these crossovers across at least two timeframes – for example, a Golden Cross on the 1-hour chart, followed by a similar setup on the 15-minute chart, provides stronger conviction.
Tip 4: Moving Averages as Dynamic Support and Resistance
During a strong trend, Moving Averages often act as dynamic support (in an uptrend) or resistance (in a downtrend). On NexTrader Charts, observe how price interacts with MAs like the 20 EMA or 50 SMA on your chosen trading timeframe. In an uptrend, a pullback to the 20 EMA that holds and bounces off it can be a reliable trend continuation signal. Conversely, in a downtrend, price rejecting the 20 EMA confirms bearish pressure. This interaction provides excellent opportunities for trend-following entries.
Tip 5: Aligning MA Slopes Across Multiple Timeframes
For the strongest trend confirmation, look for Moving Averages (e.g., 20 SMA, 50 SMA) on both your higher and lower timeframes to be sloping in the same direction. If the 4-hour 50 SMA is clearly trending upwards and the 15-minute 50 SMA is also trending upwards, this indicates a highly synchronized bullish trend. Such alignment across multiple timeframes, easily visible on NexTrader Charts, significantly boosts the probability of a successful trend-following trade.
Mastering multi-timeframe analysis with Moving Averages is a powerful skill for any Deriv Synthetic Index trader. With NexTrader Charts, you have access to professional-grade deriv trading tools that make this sophisticated technical analysis accessible and free. Practice these tips, experiment with different MA periods and timeframes, and you'll soon enhance your ability to confirm trends and make more informed trading decisions.
Ready to confirm your Deriv Synthetic Index trends with precision? Explore the full suite of free tools at NexTrader Charts and join our growing community on Telegram at Telegram. If you're new to Deriv, sign up for a free account via our affiliate link: Sign Up Free — Nextrader.
Trading involves risk. Past performance does not guarantee future results.