Trend-Following vs. Reversal Trading: A NexTrader Charts Comparison for Deriv Synthetic Indices
Navigating the dynamic world of Deriv synthetic indices requires robust technical analysis and reliable deriv trading tools. For traders seeking an edge without cost, NexTrader Charts offers a powerful, free platform akin to TradingView. Today, we'll delve into two fundamental trading philosophies – trend-following and reversal trading – and explore how you can effectively implement both using NexTrader Charts for instruments like V10, V75, and Boom/Crash.
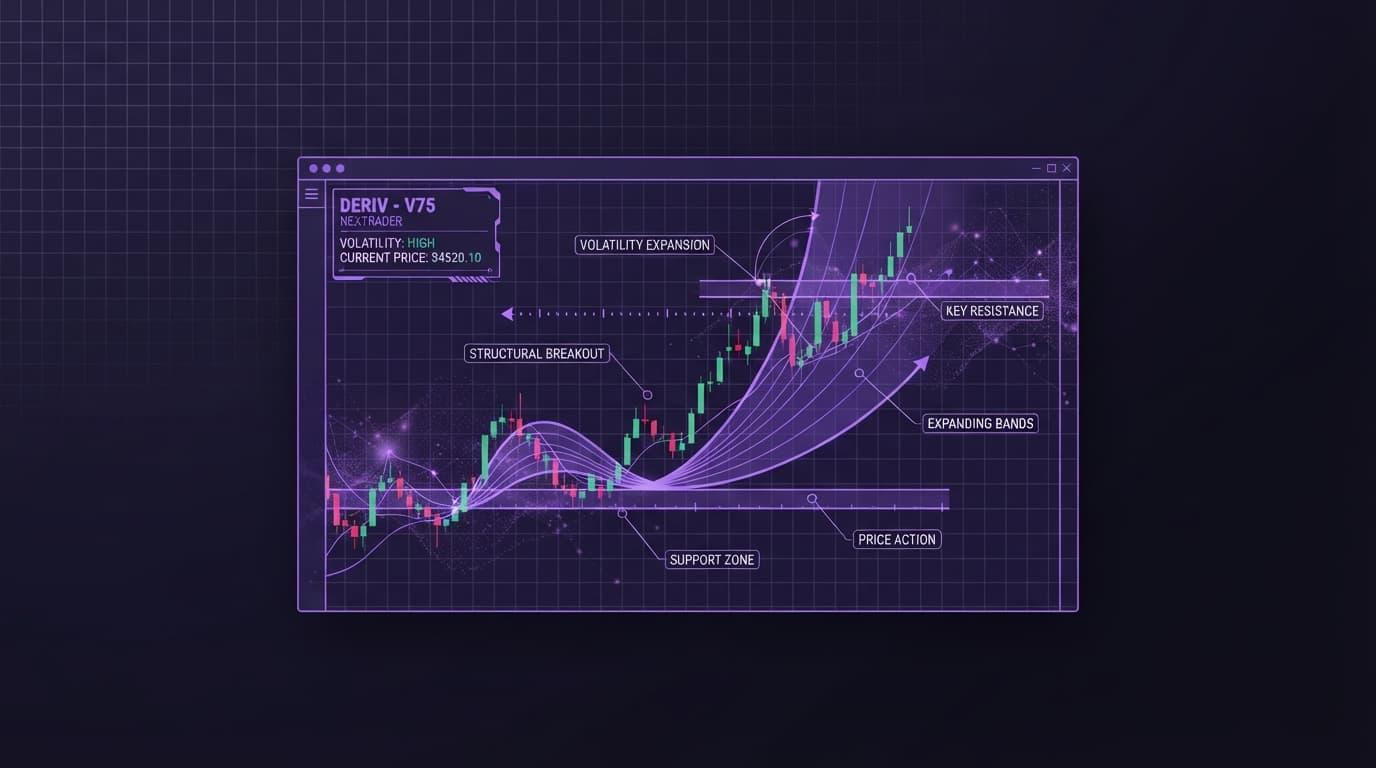
Trend-following strategies aim to capitalize on sustained price movements, riding the momentum as long as it lasts. The Moving Average (MA) is a cornerstone indicator for this approach. On NexTrader Charts, you have access to various MA types (Simple, Exponential, Weighted) which you can easily overlay on any Deriv synthetic index chart, from 1-minute to monthly timeframes. By observing MA crossovers (e.g., a short-term MA crossing above a long-term MA for a bullish signal) or price interaction with MAs acting as dynamic support/resistance, traders can identify entry and exit points aligned with the prevailing trend. This method thrives in trending markets, helping you stay on the right side of the momentum.
Conversely, reversal trading seeks to identify points where a trend is exhausted and about to reverse. The Relative Strength Index (RSI) is an invaluable oscillator for this, pinpointing overbought or oversold conditions. When the RSI on your deriv charts moves above 70, it suggests an instrument like Volatility 100 is overbought and potentially due for a downward reversal. Below 30, it signals oversold conditions, hinting at an upward bounce. Complementing RSI, drawing horizontal Support and Resistance (S/R) lines using NexTrader Charts’ intuitive drawing tools is crucial. These price levels often act as barriers where trends pause or reverse, providing high-probability entry points for counter-trend trades.
Comparing Strategies on NexTrader Charts for Deriv Synthetic Indices
Both trend-following with Moving Averages and reversal trading with RSI and S/R offer distinct advantages, and NexTrader Charts empowers you to master both. Trend-following is generally considered less risky for beginners as it aligns with the market's path of least resistance. It's excellent for capturing large moves on instruments like V50 or Crash 1000. Reversal trading, while potentially offering quick profits, requires more precision and experience, as you're essentially betting against the current momentum.
Analyze Deriv Markets Free
Pro-grade Deriv charts with 100+ indicators — RSI, MACD, Bollinger, Ichimoku. Synthetic indices, forex & crypto.
- 100+ Indicators
- Price Alerts
- All Timeframes
- Free Forever
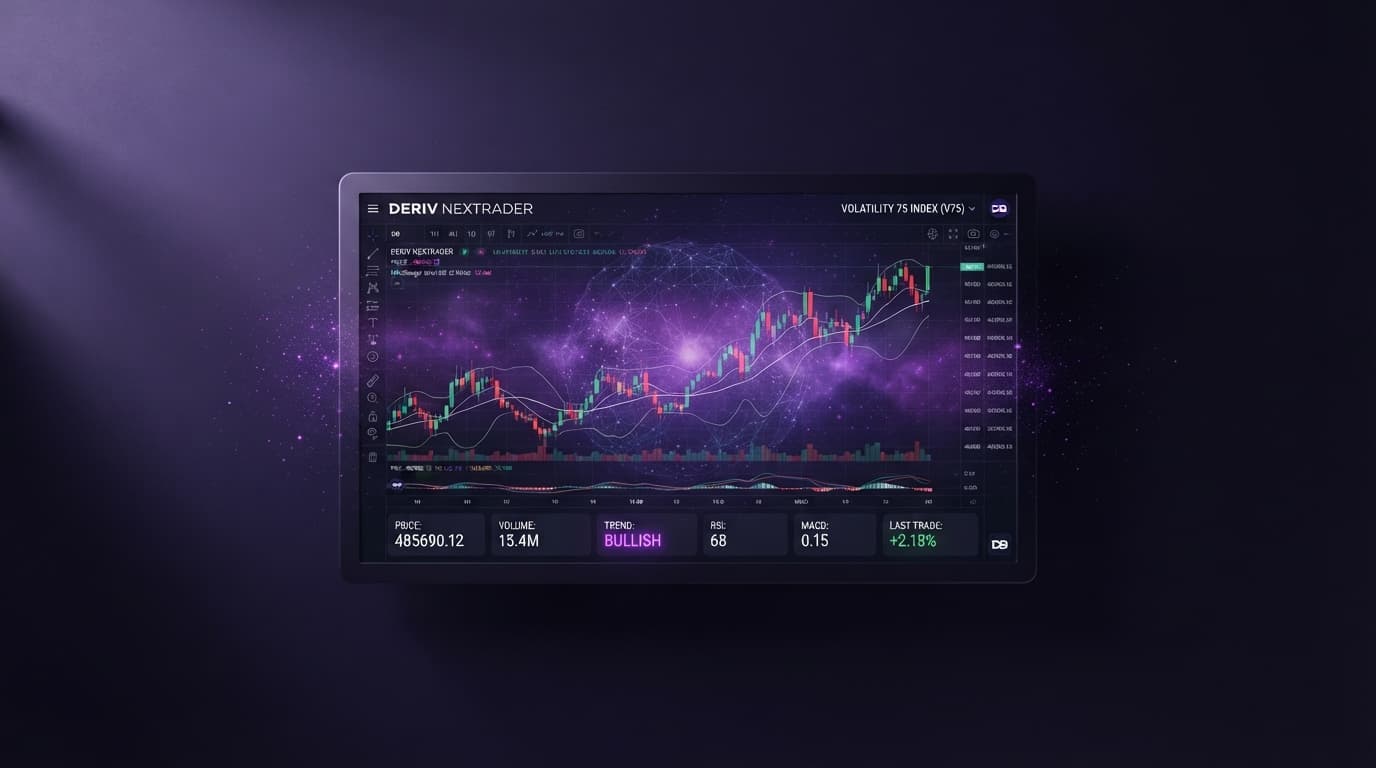
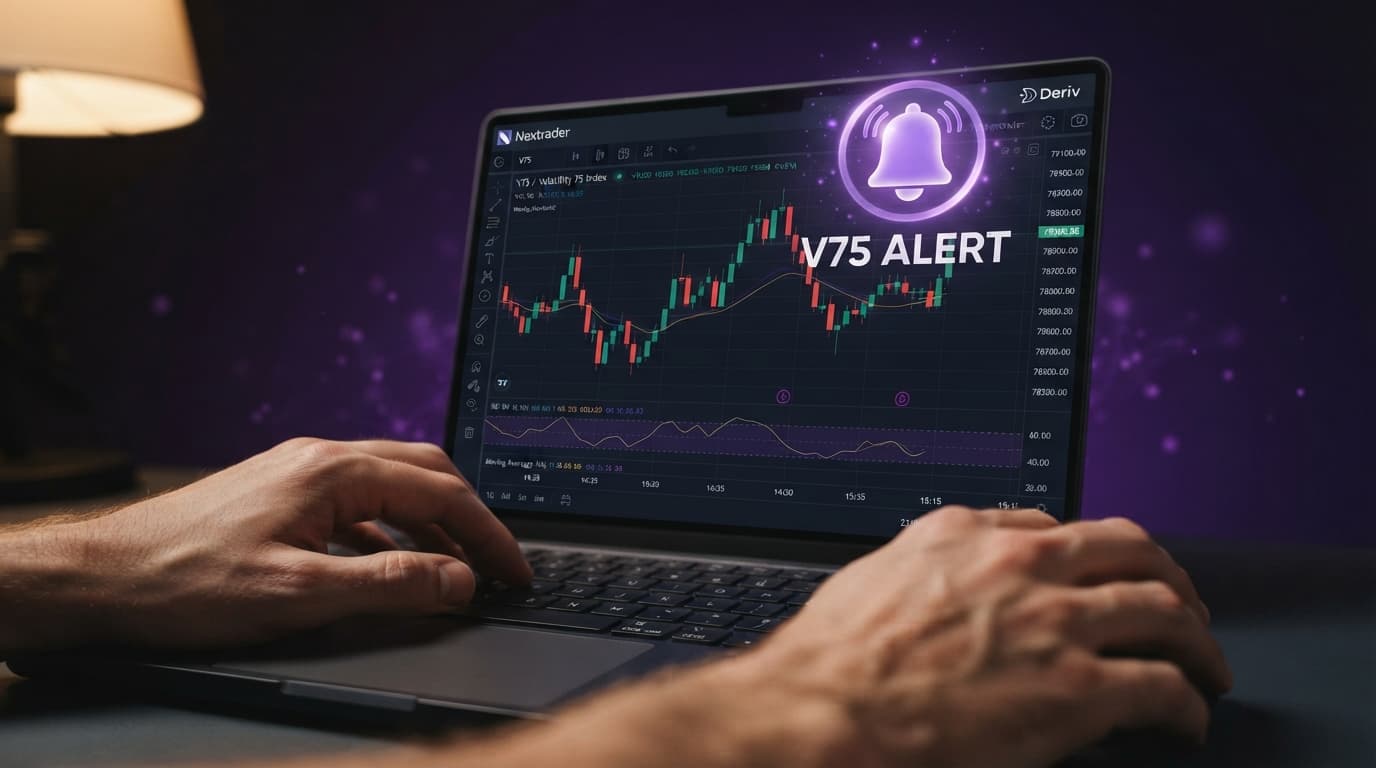
The beauty of NexTrader Charts is its versatility. You can use the platform to combine these approaches for enhanced confirmation. For instance, a trend-follower might wait for a bullish MA crossover and a bounce off a key support level before entering. A reversal trader might look for an RSI overbought signal and price rejection at a strong resistance level. With over 100 technical indicators at your disposal, including Bollinger Bands, MACD, and Stochastic, you can build sophisticated strategies tailored to your risk tolerance and trading style. The ability to save chart templates and set price alerts ensures you never miss a potential opportunity across all Deriv markets, including forex and crypto.
Practical Application with NexTrader Charts
To get started, open your desired Deriv synthetic index on NexTrader Charts. For trend-following, add two Exponential Moving Averages (e.g., 20-period and 50-period) to your chart. Look for crossovers on higher timeframes (e.g., 1-hour or 4-hour) for stronger trend signals. For reversal trading, add the RSI oscillator with standard settings (14 periods) and use the drawing tools to mark significant support and resistance zones. Watch for price reactions at these levels combined with RSI overbought/oversold signals. Remember, the 24/7 nature of synthetic indices means you have constant opportunities to practice and refine your deriv chart analysis. NexTrader Charts provides the professional-grade environment for all your deriv trading tools needs, 100% free.
Unlock your full trading potential with NexTrader Charts and elevate your Deriv trading. Explore advanced charting, indicators, and analysis tools now!
Start your journey at NexTrader Charts or sign up for free at Sign Up Free — Nextrader. Join our community on Telegram: Telegram.
Trading involves risk. Past performance does not guarantee future results.