Mastering Multi-Timeframe Ichimoku Cloud Confirmation for Deriv V100 Trend Trading on NexTrader Charts
For Deriv traders navigating the dynamic world of synthetic indices, especially the volatile V100, identifying and confirming strong trends is paramount. While numerous technical indicators exist, the Ichimoku Kinko Hyo, commonly known as the Ichimoku Cloud, stands out for its comprehensive view of support, resistance, trend direction, and momentum. When combined with a multi-timeframe approach, this powerful indicator can significantly enhance your deriv chart analysis, providing robust confirmations for high-probability trend trades. And the best part? You can implement this sophisticated strategy entirely free using NexTrader Charts, your go-to platform for professional deriv charts.
NexTrader Charts provides professional real-time charting for all Deriv instruments, including the V100 index, with TradingView-grade technology at absolutely no cost. You gain access to over 100 technical indicators, including the full suite of Ichimoku components, across timeframes from 1-minute to monthly. This makes it an indispensable deriv trading tool for serious traders. By leveraging the comprehensive features of NexTrader Charts, you can visualize the Ichimoku Cloud across different timeframes to gain a holistic understanding of the market's underlying trend for V100.
The core idea behind multi-timeframe Ichimoku confirmation is to use higher timeframes to establish the dominant trend and lower timeframes to pinpoint precise entry and exit points that align with that trend. This eliminates the noise of smaller fluctuations and helps you trade with the larger market flow, reducing false signals often encountered with single-timeframe analysis. It’s a powerful approach to technical analysis that brings clarity to complex market movements.
Setting Up Your V100 Ichimoku Strategy on NexTrader Charts
To begin, open NexTrader Charts and select the V100 index. From the indicator menu, add the "Ichimoku Cloud." NexTrader Charts will instantly display the five key components:
Analyze Deriv Markets Free
Pro-grade Deriv charts with 100+ indicators — RSI, MACD, Bollinger, Ichimoku. Synthetic indices, forex & crypto.
- 100+ Indicators
- Price Alerts
- All Timeframes
- Free Forever
- Kumo (Cloud): The most visually prominent feature, formed by the Senkou Span A and B. A green cloud indicates a bullish trend, while a red cloud suggests a bearish trend. The cloud itself acts as dynamic support and resistance.
- Tenkan-Sen (Conversion Line): A faster-moving average, often indicating short-term momentum.
- Kijun-Sen (Base Line): A slower-moving average, representing medium-term momentum.
- Chikou Span (Lagging Span): The closing price shifted 26 periods back, used to confirm price action relative to past trends.
For effective multi-timeframe analysis on V100, we recommend starting with a higher timeframe like the 4-hour (4H) or Daily chart to identify the overarching trend. Look for the price to be consistently above a bullish cloud (green) for an uptrend, or below a bearish cloud (red) for a downtrend. Confirm this with the Chikou Span being above/below the price and the Tenkan-Sen above/below the Kijun-Sen, respectively. This initial step establishes your primary directional bias using your free deriv charts.
Multi-Timeframe Confirmation and Entry Tactics
Once the dominant trend on V100 is established on a higher timeframe, switch to a lower timeframe, such as the 1-hour (1H) or 30-minute (30M) chart, to look for entry signals that align with the higher timeframe's trend. For example, if the 4H chart shows a strong uptrend (price above a green cloud), wait for the 1H chart to also show bullish Ichimoku signals – perhaps a price bounce off the cloud, a Tenkan-Sen/Kijun-Sen crossover, or a bullish Kumo breakout.
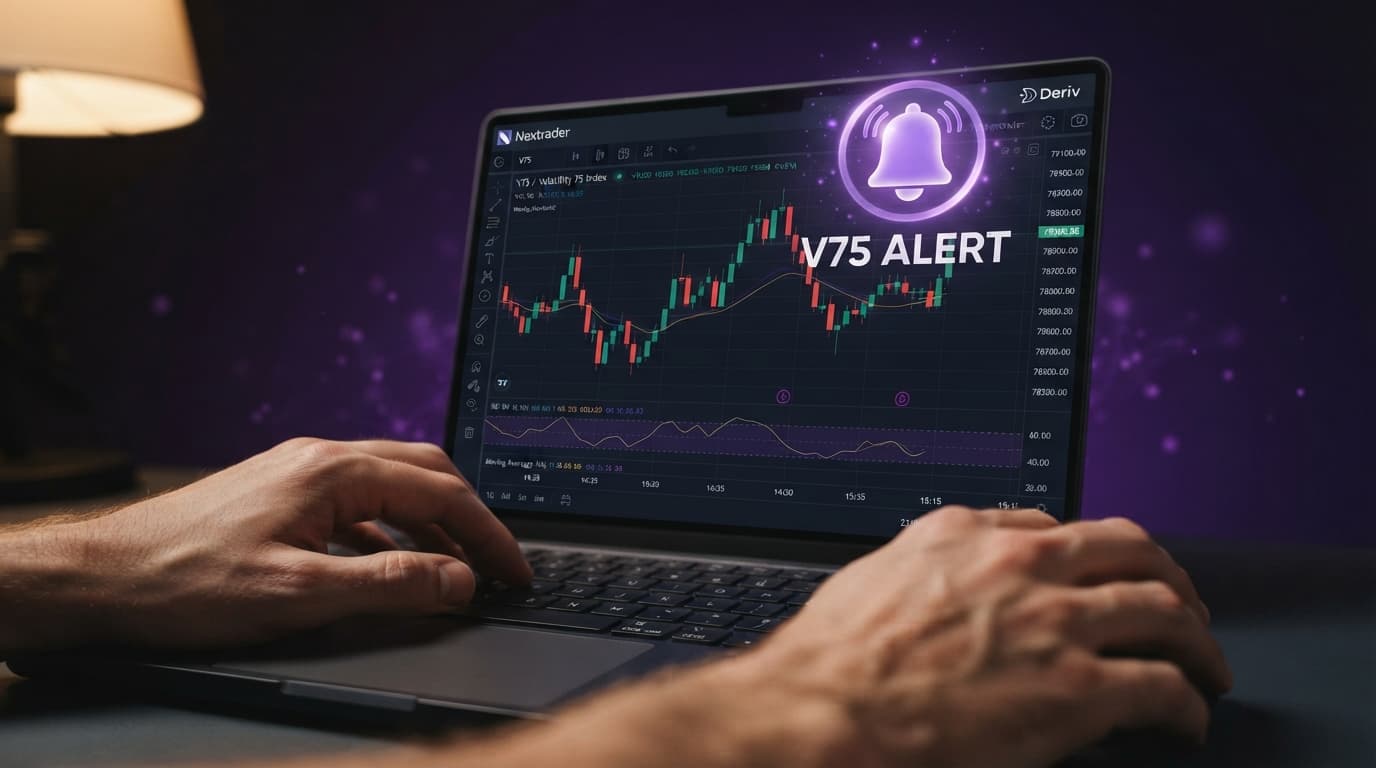
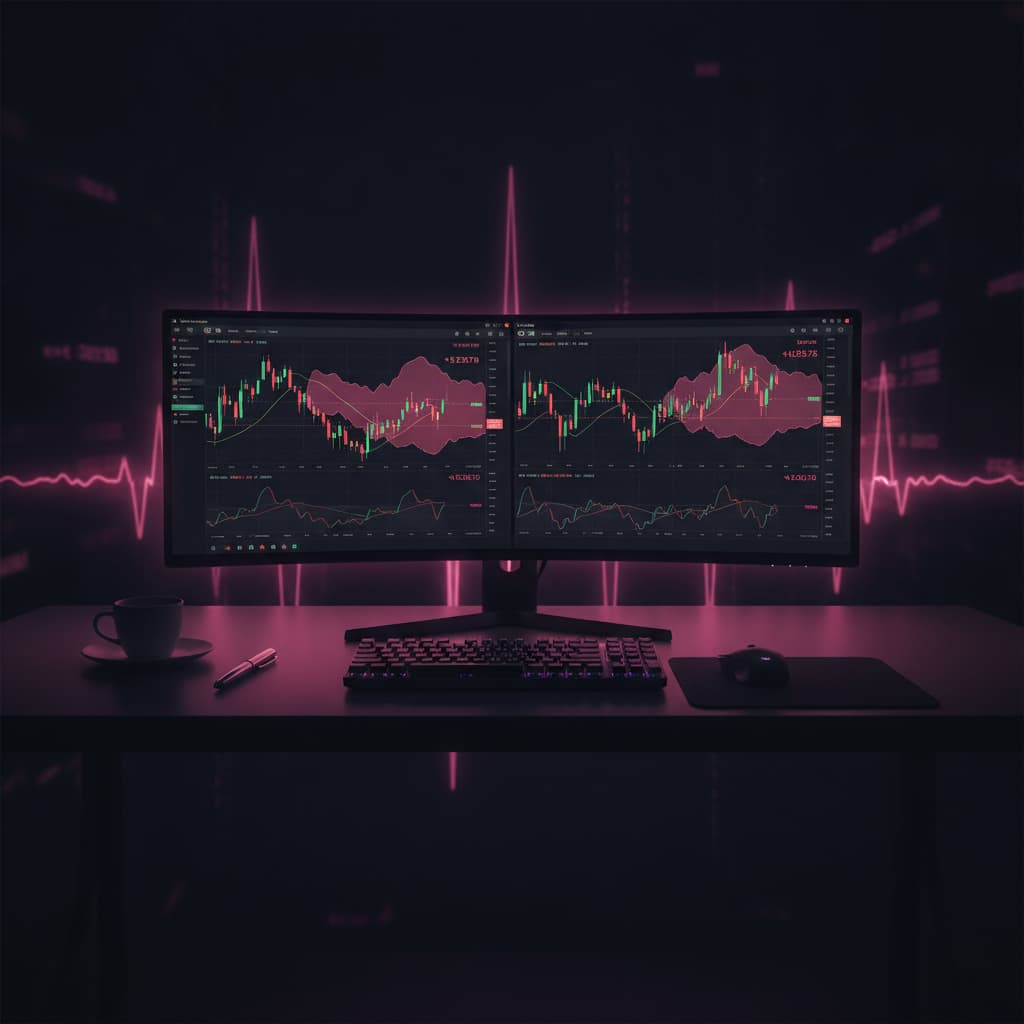
NexTrader Charts allows you to easily switch between timeframes and even compare charts side-by-side. You can save your Ichimoku setup as a template for quick application across different Deriv instruments. Use the drawing tools to mark trendlines, support, and resistance levels identified on the higher timeframe, then observe how price reacts to these levels on the lower timeframe within the context of the Ichimoku Cloud. Price alerts can also be set directly on NexTrader Charts to notify you when V100 approaches a critical Ichimoku level or breaks out of the cloud, ensuring you don't miss potential trade opportunities identified through your meticulous deriv chart analysis. This comprehensive approach to technical analysis empowers you to make informed decisions.
By combining the robustness of the Ichimoku Cloud with the discipline of multi-timeframe analysis on NexTrader Charts, you gain a significant edge in navigating the V100 market. This powerful combination of deriv trading tools helps filter out noise, confirm trends, and identify high-probability entry points, all within a completely free and professional charting environment.
Unlock the full potential of your Deriv trading strategy today. Explore professional-grade deriv charts and advanced technical analysis tools for free.
Start your advanced Deriv chart analysis now: NexTrader Charts
Sign up for more free tools: Sign Up Free — Nextrader
Join our Telegram community: Telegram
Trading involves risk. Past performance does not guarantee future results.