Demystifying Deriv Candlestick Charts: A Beginner's Guide to Understanding Open, High, Low, and Close Prices on NexTrader
For any Deriv trader navigating the dynamic world of synthetic indices, forex, or commodities, understanding price action is paramount. While raw price data can be overwhelming, candlestick charts offer a visually intuitive way to decipher market sentiment and potential future movements. These powerful visual tools distill complex price information into easy-to-understand bars, making them the cornerstone of effective deriv chart analysis.
At NexTrader Charts, we provide professional, real-time charting for all your Deriv instruments, completely free. Our platform offers TradingView-grade technology, equipping you with everything you need to master candlestick interpretation. Before diving into advanced strategies, the fundamental step is to grasp the core components of every candlestick: the Open, High, Low, and Close prices, often abbreviated as OHLC.
These four price points tell a compelling story about market activity within a specific timeframe – whether it's a 1-minute, 1-hour, or daily chart. By learning to read these elements, you unlock the ability to see not just where the price ended up, but the journey it took, revealing volatility, buyer/seller pressure, and potential turning points. This foundational knowledge is crucial for any trader serious about robust technical analysis.
The Anatomy of a Candlestick: OHLC Explained
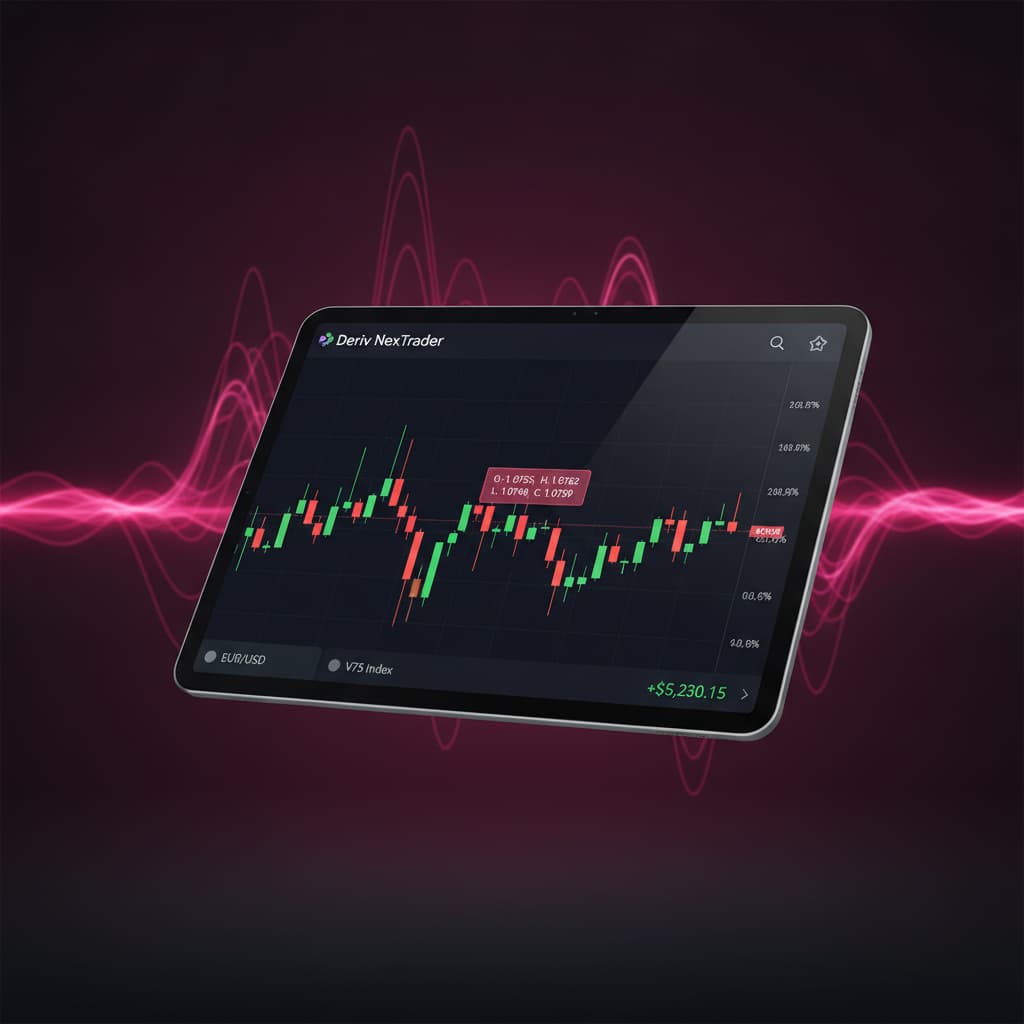
Every candlestick on your deriv charts at NexTrader tells a complete price story for its given timeframe. It consists of a "body" and two "wicks" or "shadows."
Analyze Deriv Markets Free
Pro-grade Deriv charts with 100+ indicators — RSI, MACD, Bollinger, Ichimoku. Synthetic indices, forex & crypto.
- 100+ Indicators
- Price Alerts
- All Timeframes
- Free Forever
- Open (O): This is the first price traded during the candlestick's timeframe. On NexTrader Charts, a bullish (usually green or white) candle opens at the bottom of its body, while a bearish (usually red or black) candle opens at the top of its body.
- High (H): The highest price reached during the timeframe. This is represented by the very top of the upper wick.
- Low (L): The lowest price reached during the timeframe. This is represented by the very bottom of the lower wick.
- Close (C): The last price traded during the timeframe. For a bullish candle, the close is at the top of the body; for a bearish candle, it's at the bottom of the body.
The color of the candlestick body immediately tells you if the price increased or decreased during that period. If the Close is higher than the Open, it's a bullish candle (price went up). If the Close is lower than the Open, it's a bearish candle (price went down). Understanding these simple mechanics on your deriv charts is the first step towards sophisticated deriv chart analysis.
Practical Insights from OHLC on NexTrader Charts
Understanding OHLC isn't just an academic exercise; it's a practical skill that fuels effective technical analysis. Long bullish bodies suggest strong buying pressure, while long bearish bodies indicate aggressive selling. Short bodies with long wicks, on the other hand, can signal indecision or a potential reversal. For instance, a long upper wick and a small body could mean buyers pushed prices high, but sellers ultimately brought them back down – a sign of potential weakness.
NexTrader Charts empowers you to apply this knowledge across various Deriv instruments, from V100 synthetic indices to Gold. You can switch between timeframes, from 1-minute to monthly, to observe how OHLC values change and reveal different market dynamics. Use our extensive range of deriv trading tools, including 100+ technical indicators like RSI or Bollinger Bands, and drawing tools, to complement your candlestick interpretation. Spotting key support and resistance levels based on past Highs and Lows, or identifying trend continuations from Open and Close prices, becomes intuitive. NexTrader makes advanced deriv chart analysis accessible to everyone, helping you make more informed trading decisions.
Ready to put your knowledge into practice? Head over to NexTrader Charts and start exploring real-time Deriv markets.
Start mastering your Deriv chart analysis today at NexTrader Charts. For more advanced features and community discussions, create a free account at Sign Up Free — Nextrader and join our Telegram community: Telegram.
Trading involves risk. Past performance does not guarantee future results.