Case Study: Catching Boom 500 Reversals with NexTrader Fibonacci and Saved Templates
How do you catch high-probability spike reversals on Boom 500 using Fibonacci retracements? To catch a clean reversal after a Boom 500 spike, measure the full length of the sudden price jump using the Fibonacci tool and wait for price to retrace into the 50% or 61.8% golden ratio levels before entering a position with defined risk. Performing this process consistently on free deriv charts gives traders a structured edge over those relying on guesswork.
Boom 500 is known for sudden bullish spikes followed by slow, downward tick movements. Scalpers often attempt to short immediately after a spike, but entering blindly leads to drawdowns if a second spike fires off. Effective deriv chart analysis requires waiting for price to exhaust its initial momentum and retrace into key interest zones on lower timeframes like the 1-minute chart.
A full-time synthetic index scalper faced a common hurdle: redrawing Fibonacci levels and indicators every time they switched between synthetic assets. Using NexTrader Charts, this trader saved a custom technical layout as a reusable chart template, loading exact Fibonacci levels and price alert setups instantly across multiple instruments.
Identifying the Spike Structure on Boom 500
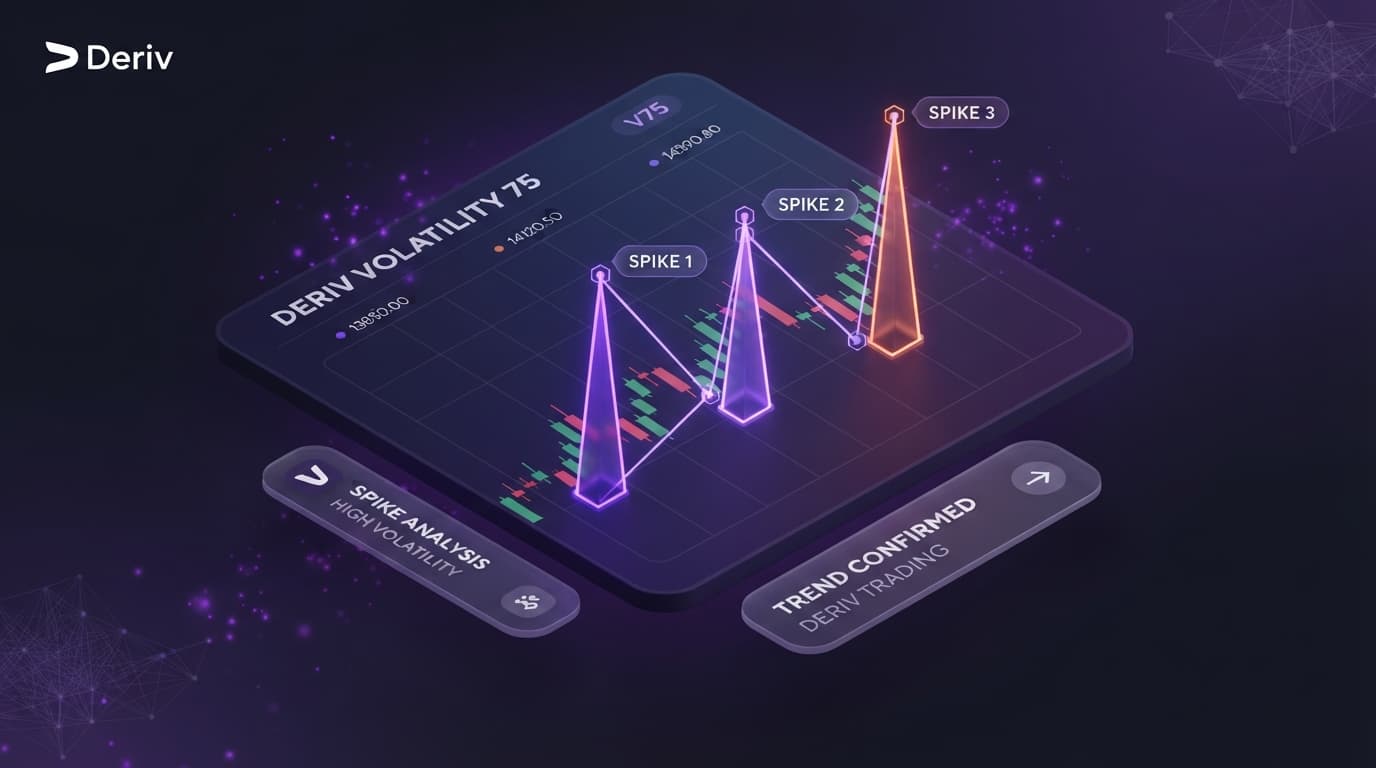
Catching a valid reversal starts with distinguishing a routine spike from a true exhaustion move. The trader monitored the 5-minute chart to identify market structure shifts. When Boom 500 printed a massive spike directly into an established higher-timeframe resistance zone, the setup activated. Applying disciplined technical analysis meant ignoring minor spikes and focusing exclusively on moves stretching price away from short-term moving averages. This filtering reduced false entries and preserved capital for high-probability reversals.
Analyze Deriv Markets Free
Pro-grade Deriv charts with 100+ indicators — RSI, MACD, Bollinger, Ichimoku. Synthetic indices, forex & crypto.
- 100+ Indicators
- Price Alerts
- All Timeframes
- Free Forever
Mapping Fibonacci Retracements Precision Levels
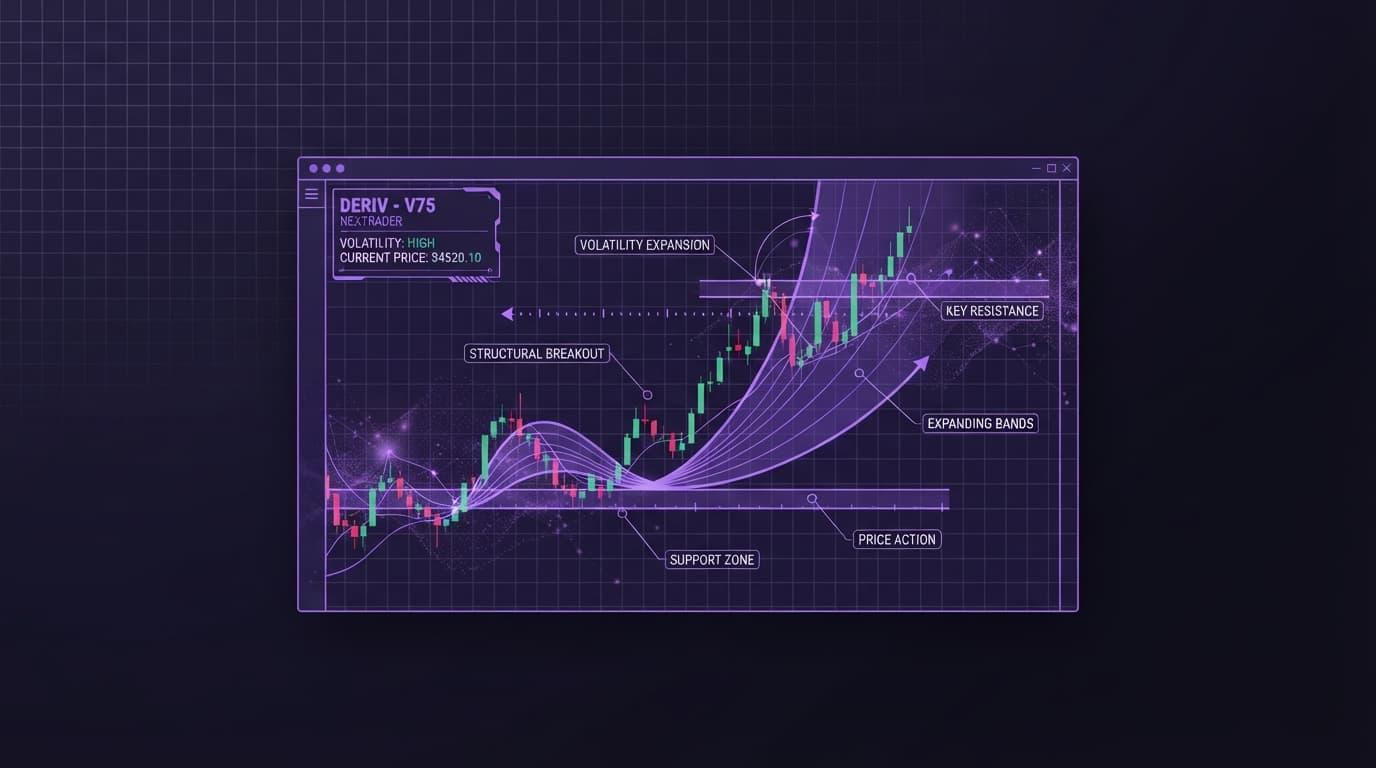
Once a major spike topped out, the trader drew a Fibonacci retracement from the swing low prior to the spike up to the peak wick. On NexTrader Charts, drawing tools snap directly to price action. Instead of shorting randomly during the drop, the scalper waited for price to retrace into the 50% to 61.8% golden ratio zone. When price reached the 61.8% level and displayed slowing tick movement, it provided a precise entry with a tight stop-loss placed just above the 78.6% level.
Standardizing Strategy with Saved Templates
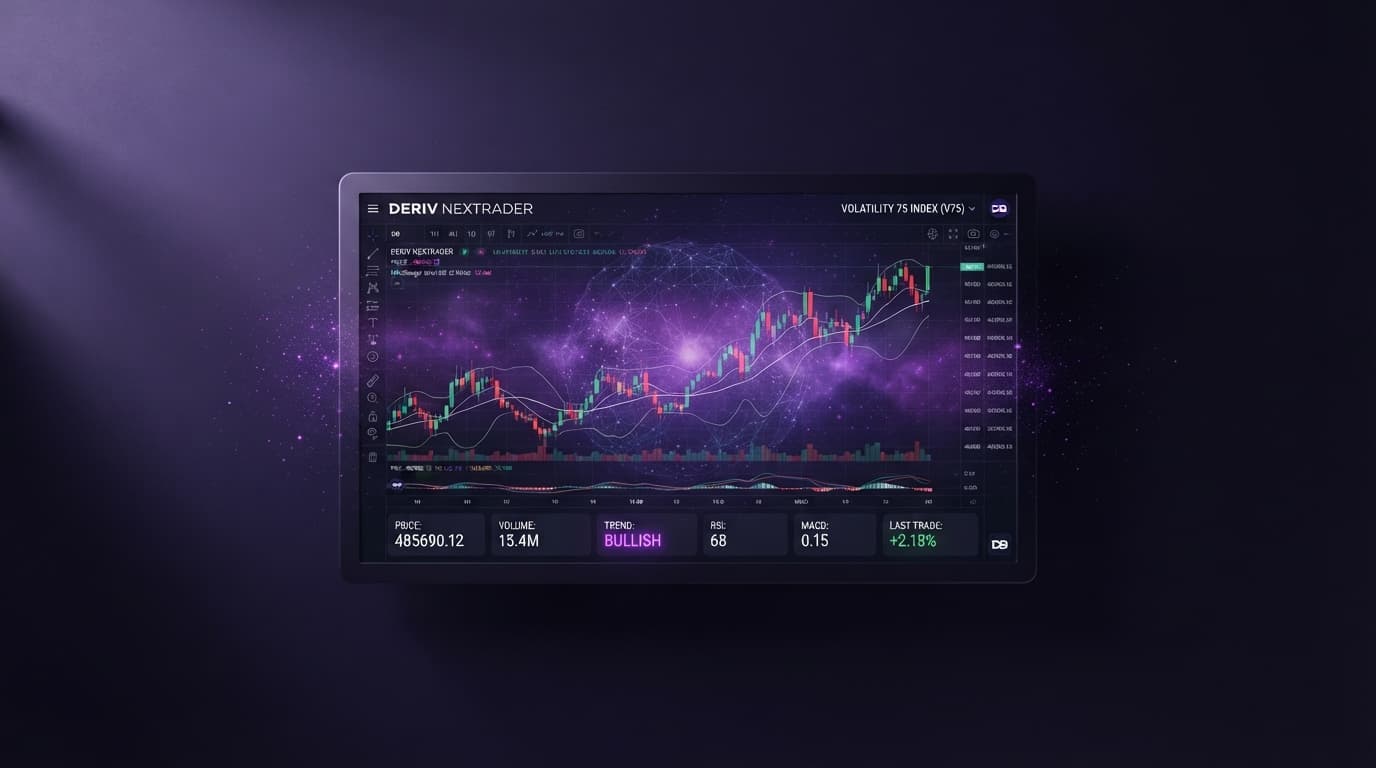
Speed is critical when analyzing synthetic indices that trade 24/7. To avoid wasting seconds setting up tools during volatile moves, the trader saved their complete setup into a reusable chart template. Access to these robust deriv trading tools allowed the scalper to apply Fibonacci settings, custom indicators, and drawing shortcuts instantly. When Boom 500 delivered a setup, the chart configured in one click, enabling full focus on precise execution rather than setup tasks.
Execution, Risk Control, and Results
In this case study, the trader entered a short scalp at the 61.8% Fibonacci level on Boom 500. Risk was capped at 10 ticks above the Golden Ratio line, maintaining a 1:3 risk-to-reward ratio. As price resumed its downward tick sequence, the position hit its target before any secondary spike occurred. Standardizing this Fibonacci reversal workflow with saved chart templates transformed chaotic scalping into a repeatable, systematic routine.
Upgrade Your Charting Strategy Today
Ready to refine your Boom 500 trading with professional tools? Analyze synthetic indices for free on NexTrader Charts. Create your trading account through our official Deriv Signup Link and join our active Telegram group at Telegram to collaborate with synthetic index traders worldwide.
Trading involves risk. Past performance does not guarantee future results.