Mastering Fibonacci Retracements on Volatility 10 (1s) with NexTrader Charts
Trading the Volatility 10 (1s) index with Fibonacci retracements requires clean 1-second price data and accurate structural mapping. Because V10 (1s) generates a tick every second based on a fixed volatility model, price movements form defined impulse waves and pullback zones on 1-minute charts. By conducting technical analysis on deriv charts inside NexTrader Charts, you can map the 61.8% golden ratio and 78.6% invalidation boundaries with exact precision.
Step-by-Step Fibonacci Retracement Deriv Blueprint on V10 (1s)
To trade Fibonacci retracements effectively on Volatility 10 (1s), isolate multi-candle impulse waves using dedicated charting infrastructure. Navigating to NexTrader Charts gives you access to 100% free professional deriv trading tools built specifically for synthetic indices. NexTrader Charts renders 1-second price streams instantly alongside over 100 technical indicators, drawing tools, and price alert engines.
Select the Volatility 10 (1s) Index from the synthetics menu in NexTrader Charts. The V10 (1s) index outputs 60 price ticks every minute, operating continuously 24/7. Switch your chart timeframe to 1 minute (1m) to filter micro-noise while retaining clear swing visibility.
Identify an impulse wave where consecutive strong-bodied candles break recent market structure. Then, open the Fibonacci Drawing Tool from the left toolbar in NexTrader Charts.
Analyze Deriv Markets Free
Pro-grade Deriv charts with 100+ indicators — RSI, MACD, Bollinger, Ichimoku. Synthetic indices, forex & crypto.
- 100+ Indicators
- Price Alerts
- All Timeframes
- Free Forever
- 1 Select Volatility 10 (1s) on the 1m timeframe inside NexTrader Charts
- 2 Identify a multi-candle impulse wave breaking local market structure
- 3 Anchor the Fibonacci tool from Swing Low (100.0%) to Swing High (0.0%)
- 4 Set a real-time price alert on NexTrader Charts at the 61.8% golden ratio
- 5 Wait for retest, confirm price rejection, and execute a Multiplier trade with GSL past 78.6%
For a bullish impulse wave, click the Swing Low to set your 100.0% anchor, then drag the tool upward to place the 0.0% level at the peak of the Swing High. This projects retracement levels downward into the pullback zone. For a bearish impulse wave, anchor 100.0% at the Swing High peak and drag the tool down to place 0.0% at the Swing Low.
Use the coordinate lock and magnet tool in NexTrader Charts to snap drawing anchors directly to extreme candle wicks. This guarantees that your 61.8% golden ratio and 78.6% levels match exact market coordinates.
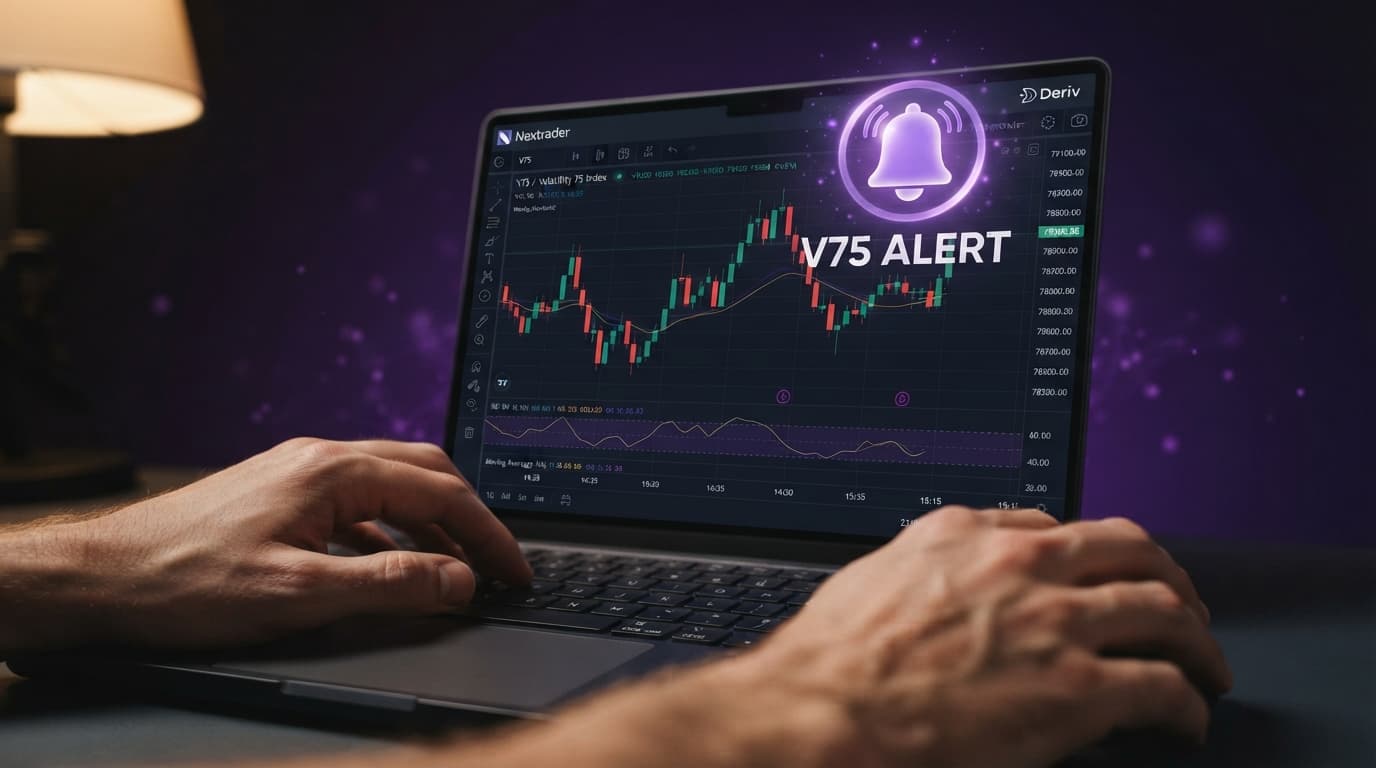
Once your grid is anchored, set a native Price Alert inside NexTrader Charts directly on the 61.8% price level. Automated notifications prevent missed entries when fast-moving 1Hz tick data hits your key level.
Save your layout using the Template Saving feature in NexTrader Charts. Storing custom Fibonacci configurations lets you instantly load the same visual setup across V25, V50, V75, and V100 markets.
Multiplier Execution & Invalidation Below 78.6%
Plotting levels on NexTrader Charts provides the quantitative entry framework. When Volatility 10 (1s) price action enters the 61.8% Fibonacci zone, wait for a 1-minute confirmation candle to close—such as a rejection pin bar or an engulfing candle aligned with the primary trend direction.
After price rejection confirms at the 61.8% golden ratio on NexTrader Charts, open a Deriv Multiplier position in the direction of the impulse wave. Multipliers provide leveraged upside exposure while capping potential losses to your initial stake.
Set your Guaranteed Stop-Loss (GSL) 1 to 2 ticks beyond the 78.6% Fibonacci level measured on NexTrader Charts.
The 78.6% retracement level serves as the structural boundary for market pullbacks. In fixed volatility algorithms, a move past 78.6% signals a structural trend failure rather than a retracement.
Placing a Guaranteed Stop-Loss past 78.6% protects your capital against tick slippage. Because Volatility 10 (1s) updates every second, high-frequency price shifts can jump over standard stop levels. A Guaranteed Stop-Loss forces trade termination at your precise price coordinate, preserving your risk-to-reward ratio.
Analyze Volatility 10 (1s) and all synthetic markets for free on NexTrader Charts, create your account at NexTrader Signup, and join thousands of professional traders in our Telegram community at Telegram.
Trading involves risk. Past performance does not guarantee future results.