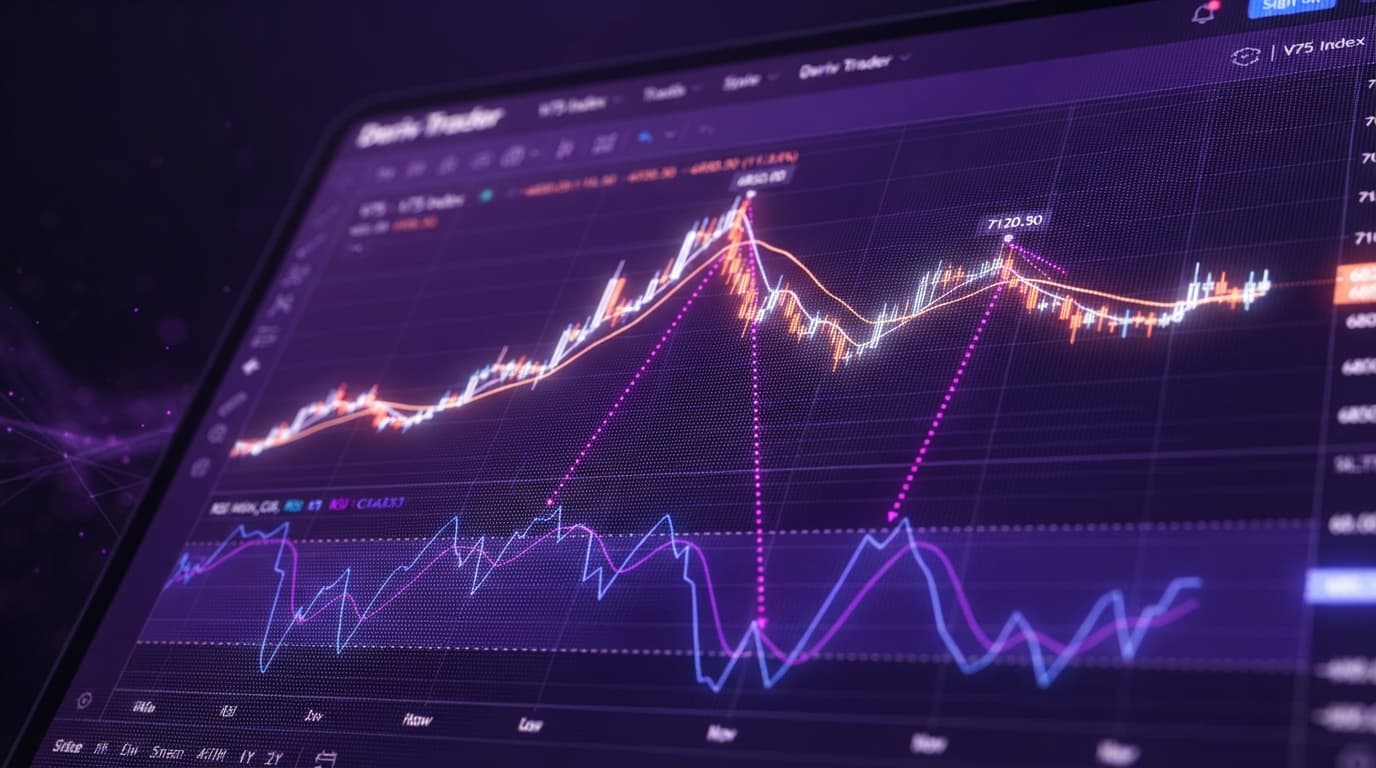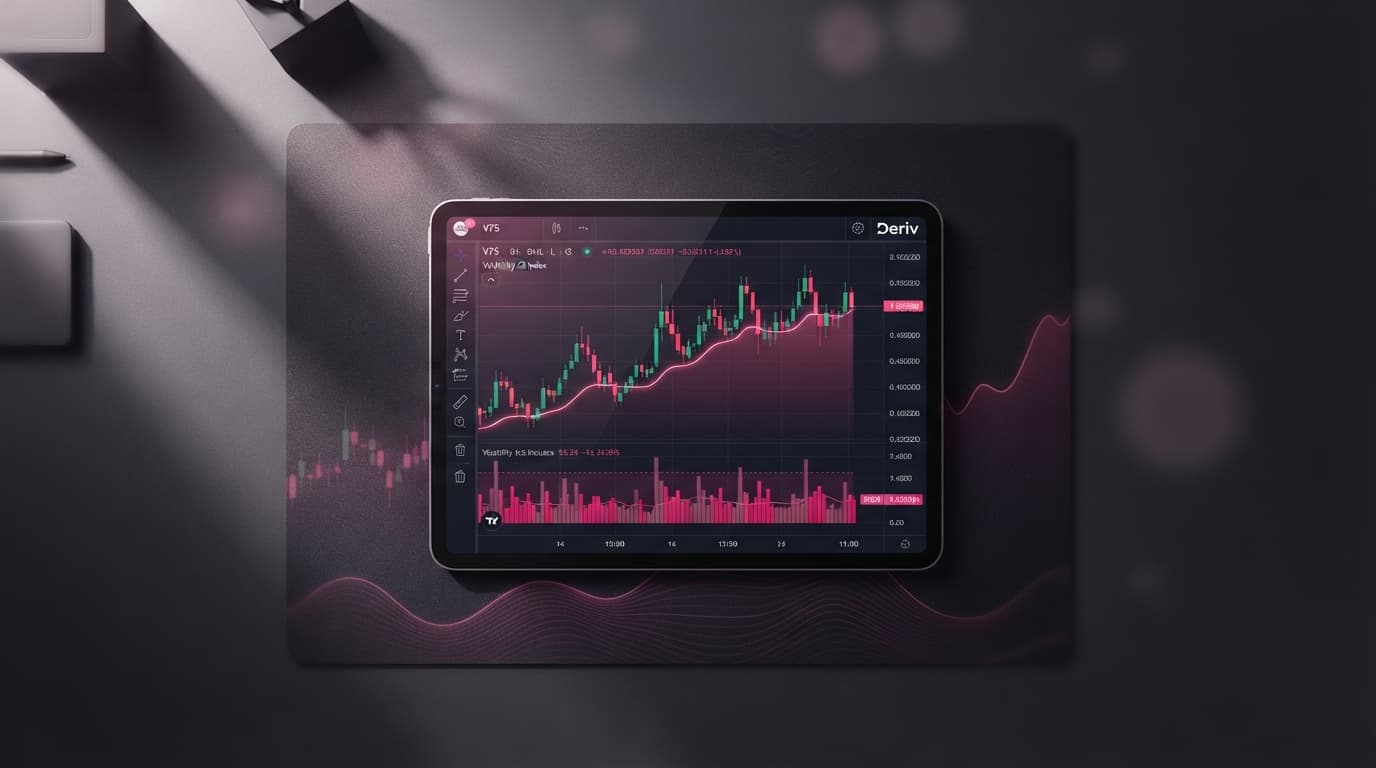
Understanding the doji candle meaning starts with recognizing total market equilibrium. A Doji candlestick forms when an asset's opening and closing prices are virtually identical within a given timeframe, printing a cross-like structure on your chart. This specific footprint reflects absolute indecision, indicating that neither aggressive buyers nor persistent sellers could maintain directional control by the close of the period.
Depending on where it forms within a market structure and how far its wicks extend, a Doji warns of an impending trend reversal due to momentum exhaustion or signals a brief pause before trend continuation. On continuous 24/7 synthetic assets like the Volatility 75 Index (V75), filtering real Doji setups from flat, low-volume noise requires combining visual candle geometry with objective volatility metrics.
Executing precise technical analysis across continuous synthetic markets demands reliable deriv trading tools and low-latency charting software. Using zero-cost NexTrader trading tools available on NexTrader Charts allows you to apply volatility filters directly over your candlestick feeds, converting raw price action into systematic entry and exit rules.
Doji Candle Meaning and Technical Mechanics
To evaluate a Doji objectively, you must move beyond visual guesswork and apply a quantitative mathematical standard to the candle's structure. In active synthetic markets, price moves continuously down to fractional decimals. Expecting an exact match between open and close prices down to the last decimal point will cause you to miss valid price action patterns.
Analyze Deriv Markets Free
Pro-grade Deriv charts with 100+ indicators — RSI, MACD, Bollinger, Ichimoku. Synthetic indices, forex & crypto.
- 100+ Indicators
- Price Alerts
- All Timeframes
- Free Forever
A candle mathematically qualifies as a Doji when its open-close body height meets either of these two strict conditions:
- Percentage of Range Rule: The total absolute height of the candle body (
|Close - Open|) is less than 5% of the total high-to-low candle range (High - Low). - ATR Volatility Rule: The body height is less than 0.1 times the 14-period Average True Range (
Body Height < 0.1 × ATR(14)).
Evaluating Volatility on Volatility 75 Index (V75)
Consider a real-time price scenario on the 15-Minute (15m) timeframe for the Volatility 75 Index (V75) on NexTrader Charts:
- Open Price: 450,000.00
- High Price: 452,500.00
- Low Price: 447,500.00
- Close Price: 450,050.00
To calculate the structural integrity of this candlestick:
- Total Candle Range: $452,500.00 - 447,500.00 = 5,000\text{ points}$
- Real Body Height: $|450,050.00 - 450,000.00| = 50\text{ points}$
- Body Percentage: $(50 / 5,000) \times 100 = 1\%$
Because $1\%$ is well below the $5\%$ maximum body threshold, the candlestick meets the structural criteria of a Doji.
Next, compare the candle's total span against market volatility using the Average True Range indicator set to period 14. If the ATR(14) on the 15m chart reads 1,800 points, the total candle range of 5,000 points easily exceeds twice the ATR value ($2 \times 1,800 = 3,600\text{ points}$). This confirms that the candle represents an explosive, high-volatility tug-of-war rather than stagnant, low-volume price drift.
The Four Structural Doji Variations on NexTrader Charts
Not all Doji patterns convey the same market message. The length and placement of the upper and lower wicks relative to the open-close body define four primary structural variations on NexTrader Charts.
What It Means for You: Executing NexTrader Chart Analysis
Build a repeatable system by placing Doji patterns into structural market context with NexTrader chart analysis and structured deriv chart analysis.
- 1 m Chart Setup -> Filter with ATR(14) -> Confirm S/R Alignment -> RSI Overbought/Oversold -> Set Breakout Alert
Contextual Location Rules
An isolated Doji in the middle of a consolidation zone carries low statistical edge. To validate a setup on NexTrader Charts:
- Use the native Horizontal Line tool to mark major daily and 4-hour support and resistance zones.
- Use the Trendline drawing tool to outline current market structure.
- Only act on Dragonfly or Gravestone Dojis when their wicks directly test or pierce marked support/resistance lines. A Dragonfly touching key horizontal support carries far more weight than one floating mid-structure.
Indicator Confluence
Boost signal quality by adding momentum confirmation:
- Load the Relative Strength Index (RSI) set to period
14on your 15m chart. - Set the overbought threshold to
70and the oversold threshold to30. - Look for a Gravestone Doji touching resistance while RSI(14) is above
70(overbought). This confirms momentum exhaustion alongside price rejection. - Look for a Dragonfly Doji touching support while RSI(14) is below
30(oversold). This indicates seller exhaustion at a key demand level.
Execution Workflow on NexTrader Charts
Once structural alignment and momentum confluence line up:
- Locate the high and low of the structural Doji candle.
- Open the Price Alert tool built directly into NexTrader Charts.
- Set a buy-stop alert slightly above the high of a Dragonfly Doji wick (or a sell-stop alert below a Gravestone Doji low).
- Use the Template Saving feature to lock in your custom layout with ATR(14), RSI(14), and drawn levels so your analysis remains saved across browser sessions.
- Utilize the Screenshot & Sharing tool to record the setup in your trading journal before executing.
Your Next Step
Apply these structural criteria directly to live deriv charts to filter out low-volume noise from actionable trade setups.
Put these rules into practice today:
- Open NexTrader Charts to access 24/7 real-time synthetic index charts.
- Select an active market like Volatility 75 Index (V75) or Volatility 100 Index (V100) on the 15m timeframe.
- Add the ATR(14) and RSI(14) indicators to your workspace.
- Use the horizontal line drawing tools to mark structural levels, and test open-close body parity against real-time price action.
For access to free trading tools, real-time index feeds, and community analysis:
- Launch free charting: NexTrader Charts
- Create your free account: Sign Up Free — Nextrader
- Join the Telegram community: Telegram
Trading involves risk. Past performance does not guarantee future results.