Mastering the dynamic world of Deriv synthetic indices demands precision, foresight, and the right deriv trading tools. While volatile, instruments like Volatility 75 or Crash 500 offer immense opportunities for those who can accurately identify crucial market turning points. At the heart of this strategy lies robust technical analysis, particularly the art of mapping multi-timeframe support and resistance (S/R) zones and leveraging automated price alerts. NexTrader Charts provides the professional-grade platform to execute these advanced strategies, absolutely free.
Deriv synthetics trade 24/7, making constant monitoring impractical. This is where advanced deriv chart analysis comes into play. By combining broader market perspectives with granular entry points, traders can significantly enhance their decision-making. NexTrader Charts offers an intuitive interface with TradingView-grade technology, allowing you to seamlessly switch between timeframes from 1-minute to monthly, ensuring you capture both the macro trend and micro opportunities. This comprehensive approach to deriv charts empowers you to identify stronger, more reliable S/R zones that hold weight across different market cycles.
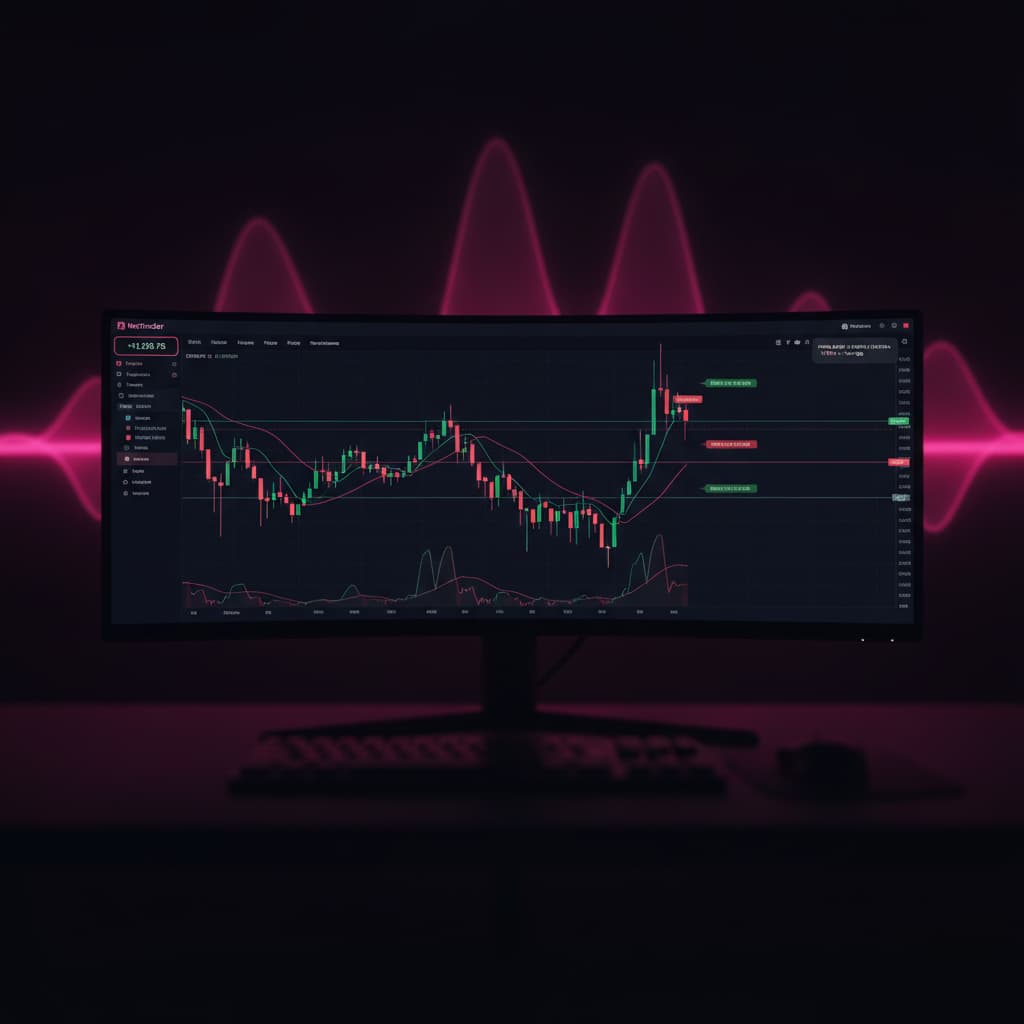
Imagine pinpointing a significant resistance level on the weekly chart, then refining your entry on the 4-hour or 1-hour chart as price approaches that zone. NexTrader Charts provides over 100 technical indicators like RSI, MACD, and Bollinger Bands, alongside powerful drawing tools for trendlines, Fibonacci retracements, and exact S/R zone mapping. You can draw precise horizontal lines or rectangles to define these zones, saving your templates for future reference and comparison across various synthetic indices like V10, V50, or Boom 1000.
Unlocking Precision: Multi-Timeframe S/R Zone Mapping
The power of multi-timeframe analysis on NexTrader Charts lies in confirming the strength of your S/R levels. Start by identifying major S/R zones on higher timeframes (e.g., Daily, H4). These levels represent significant psychological barriers or points of strong institutional interest. Use the drawing tools to mark these zones clearly. For instance, on the Volatility 100 Index, a critical support level visible on the H4 chart might gain even more significance if it aligns with a previous monthly low.
Analyze Deriv Markets Free
Pro-grade Deriv charts with 100+ indicators — RSI, MACD, Bollinger, Ichimoku. Synthetic indices, forex & crypto.
- 100+ Indicators
- Price Alerts
- All Timeframes
- Free Forever
Once major zones are established, drill down to intermediate timeframes (H1, M30) to observe how price reacts to these areas and identify potential breakout or reversal patterns. Finally, use lower timeframes (M15, M5) for precise entry and exit points within these established zones. NexTrader Charts’ real-time data ensures you're always working with the most current information. The ability to save your chart templates means you can quickly load your preferred S/R setups for V75, Crash 500, or any other Deriv instrument, streamlining your deriv chart analysis process. This structured approach, a cornerstone of effective technical analysis, helps filter out market noise and focus on high-probability setups.
Automate Your Edge: Price Alert Strategies
With your multi-timeframe S/R zones mapped out, the next step is to leverage NexTrader Charts' automated price alert feature. This is an indispensable deriv trading tool for Deriv synthetic indices, given their 24/7 trading nature. Instead of constantly monitoring your screens, you can set alerts directly on your identified S/R levels.
For example, if you’ve identified a strong resistance zone on Volatility 50 Index, set an alert for when the price enters or breaks out of this zone. This allows you to be notified instantly, giving you time to analyze the price action at the critical juncture without being glued to your screen. Whether it's a potential reversal at a support level or a breakout above resistance, these alerts ensure you don't miss crucial trading opportunities. Combine this with the ability to compare charts and take screenshots for trade journaling, and you have a complete system for advanced deriv chart analysis. This automation frees up your time, reduces emotional trading, and ensures you're always ready to act on validated setups.
Elevate your Deriv trading by integrating advanced multi-timeframe S/R mapping and automated price alerts into your routine. NexTrader Charts offers all these professional-grade deriv trading tools for free, empowering you to make more informed decisions across Deriv's diverse synthetic indices, forex, commodities, and crypto markets. Start refining your technical analysis today and experience the difference.
Unlock advanced Deriv charting and analysis at NexTrader Charts. Sign up for free at Sign Up Free — Nextrader, and join our community on Telegram: Telegram.
Trading involves risk. Past performance does not guarantee future results.