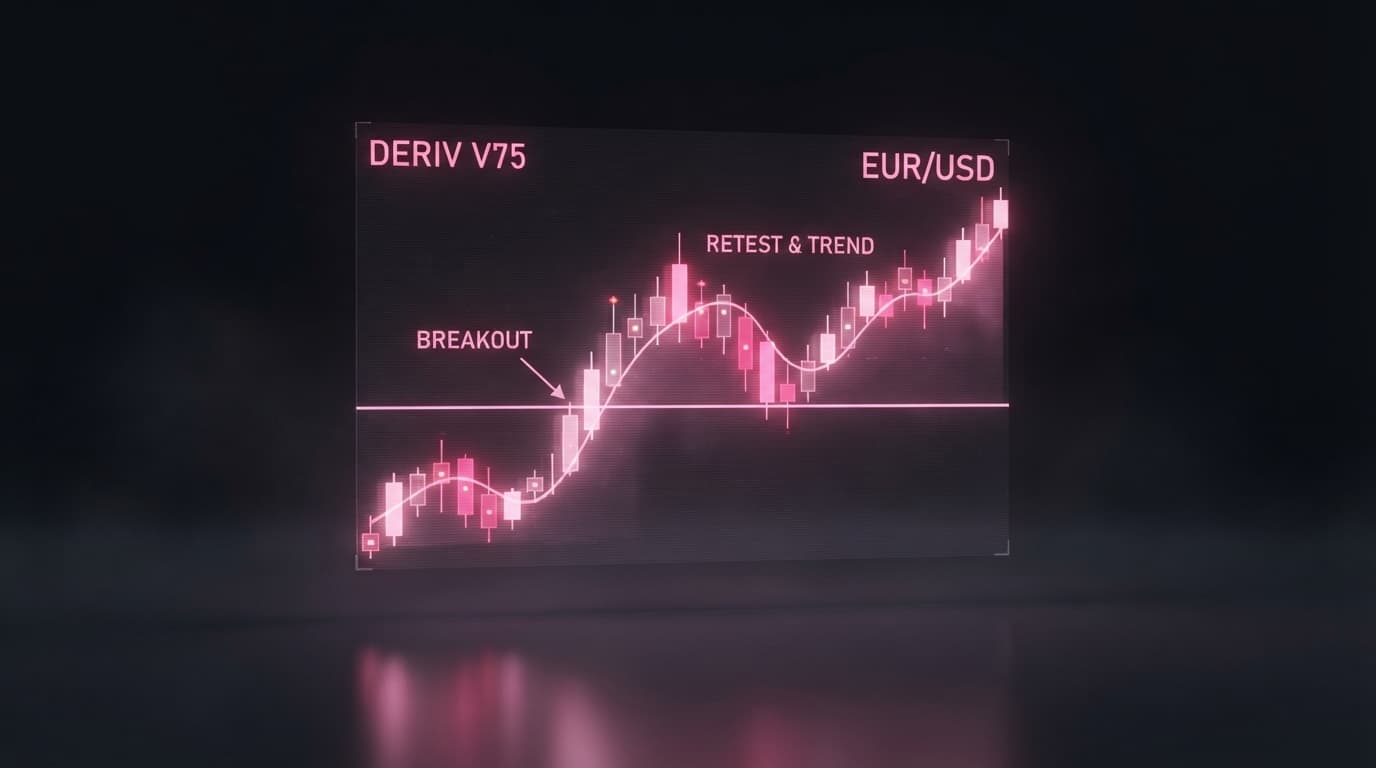
Unlock Smarter Deriv Trading: Avoid These 5 Costly Mistakes with Technical Indicators and Timeframes on NexTrader Charts
Deriv traders seeking an edge know that mastering market analysis requires precision and the right deriv trading tools. NexTrader Charts offers unparalleled, free access to professional deriv charts and advanced technical analysis features. Yet, many traders fall into common pitfalls. Understanding these mistakes, and how to avoid them with NexTrader Charts, can significantly enhance your deriv chart analysis and improve your outcomes.
Our platform provides real-time charting for all Deriv instruments – from synthetic indices like V10 and V75 to forex, commodities, and crypto – all with TradingView-grade technology and 100+ technical indicators. Having powerful tools is vital, but knowing effective usage is key.
Mastering Your Deriv Chart Analysis: Common Pitfalls & Solutions
Mistake 1: Over-Reliance on a Single Technical Indicator
Basing your entire strategy on just one indicator, like RSI or MACD, is a common, costly error. While powerful, a single indicator can give false signals. Effective technical analysis demands confluence.
Analyze Deriv Markets Free
Pro-grade Deriv charts with 100+ indicators — RSI, MACD, Bollinger, Ichimoku. Synthetic indices, forex & crypto.
- 100+ Indicators
- Price Alerts
- All Timeframes
- Free Forever
Solution: Use NexTrader Charts to combine multiple indicators. Confirm an RSI signal with a MACD crossover, or use Bollinger Bands alongside Moving Averages for trend direction. NexTrader Charts provides over 100 indicators to build robust, multi-indicator strategies tailored for your Deriv trading.
Mistake 2: Ignoring Multiple Timeframes
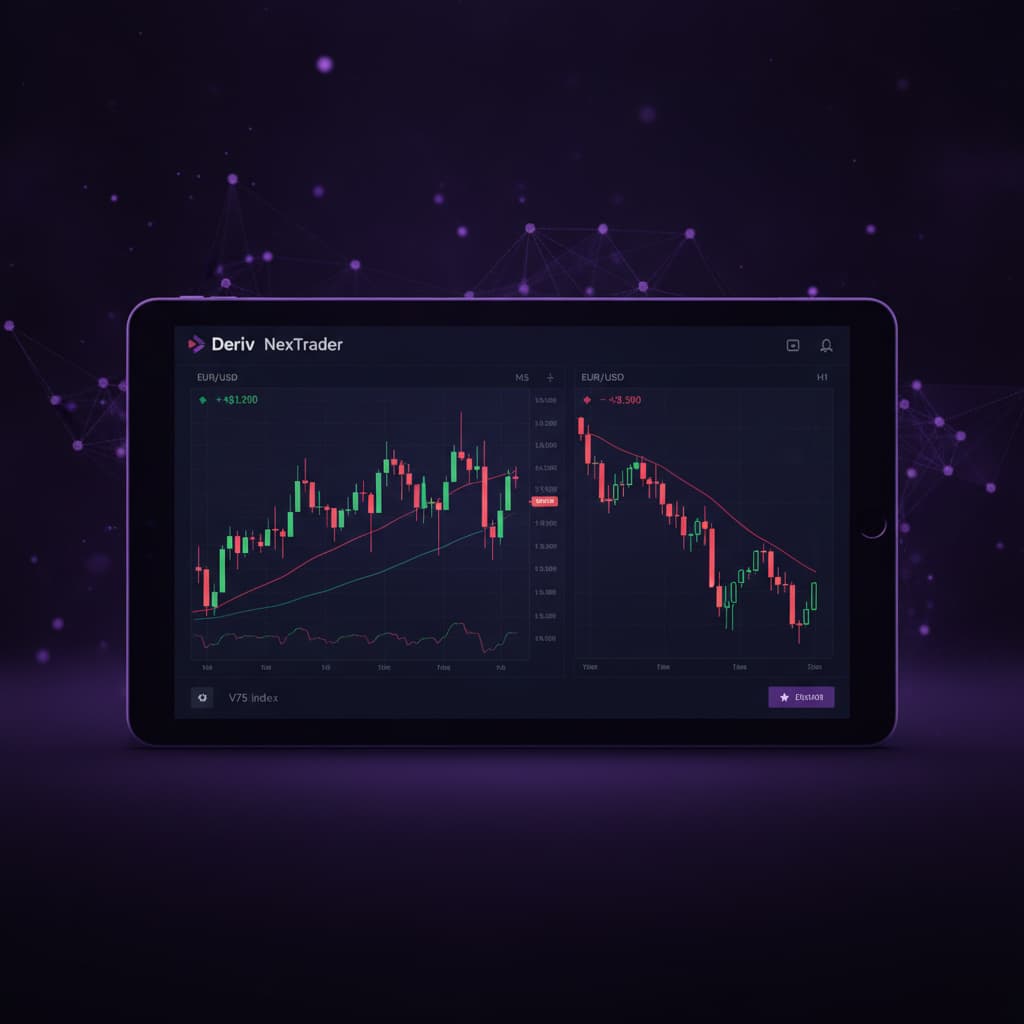
Focusing solely on a single timeframe (e.g., 5-minute entries) without understanding the broader market context is a recipe for disaster. A short-term trend might just be noise within a larger consolidation.
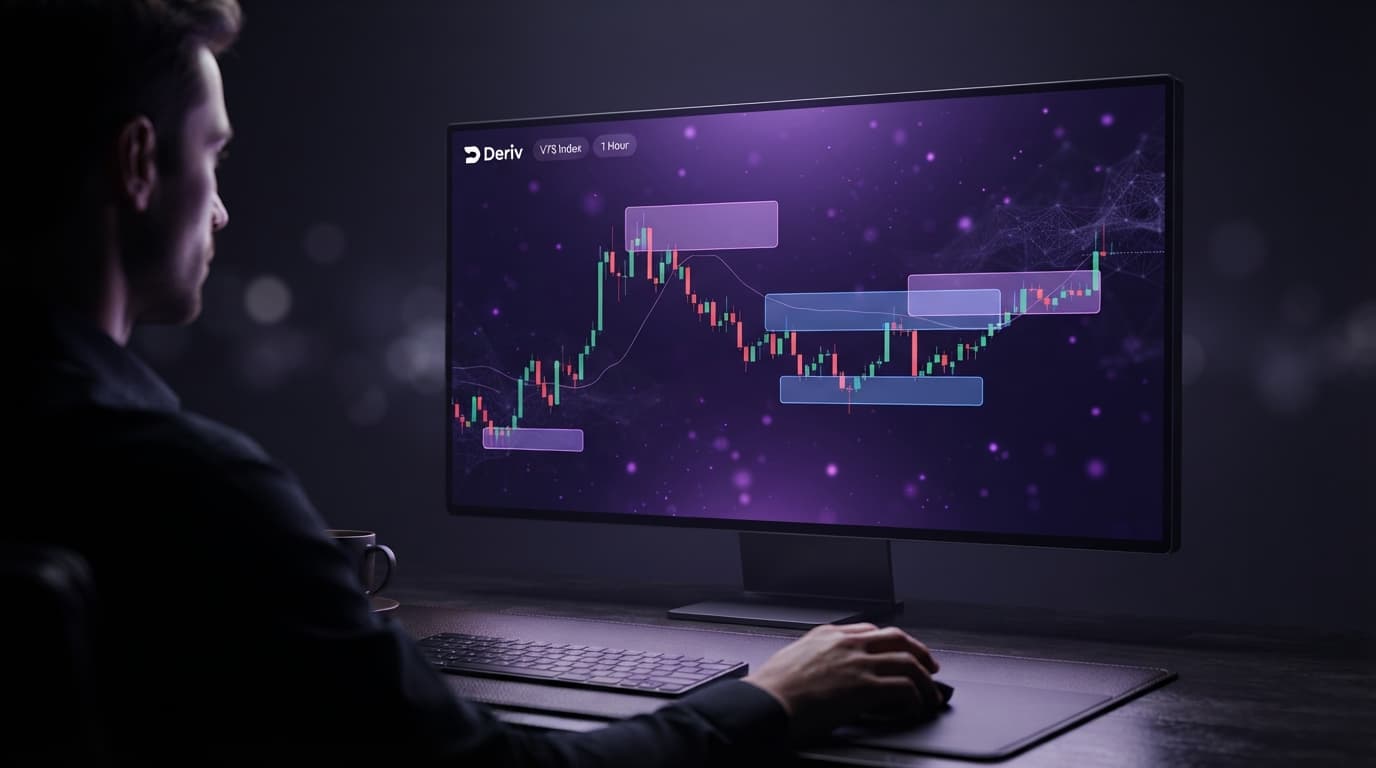
Solution: Leverage NexTrader Charts' comprehensive timeframe options, from 1-minute to monthly. Employ a top-down approach: identify the dominant trend on higher timeframes (e.g., 1-hour or 4-hour for synthetic indices), then drill down to shorter timeframes (e.g., 5-minute) to pinpoint precise entries. This holistic view provides crucial context for your deriv chart analysis.
Mistake 3: Neglecting Price Action and Drawing Tools
Some traders become so fixated on indicators they overlook fundamental price action. Support/resistance levels, trendlines, and chart patterns are the bedrock of technical analysis and often provide clearer signals.
Solution: NexTrader Charts offers a full suite of drawing tools. Make it a habit to draw trendlines, identify key support/resistance zones, and mark potential chart patterns directly on your deriv charts. Combine these visual cues with your indicators. A bullish divergence on RSI, for example, is stronger when it occurs at a significant support level.
Mistake 4: Using Default Indicator Settings Blindly
Every Deriv instrument – V10, V75, Gold, or a forex pair – has unique volatility. Using default settings for every indicator, regardless of the asset or strategy, leads to suboptimal signals.
Solution: Experiment with indicator settings on NexTrader Charts. A 14-period RSI might work for V100, but a 20-period might suit Gold better. Easily adjust parameters and save your customized indicator templates. This fine-tuning is a critical component of advanced deriv chart analysis.
Mistake 5: Failing to Practice and Backtest Your Strategies
Jumping into live Deriv trading with a new strategy without prior practice or backtesting is a quick way to incur losses. You need to understand how your chosen indicators and timeframes perform.
Solution: Utilize NexTrader Charts for rigorous practice. Analyze historical data, identify past trade setups, and see how your strategy would have performed. Take screenshots of your analyses to review your decision-making. Consistent practice with free deriv trading tools builds confidence and refines your approach.
Elevate Your Deriv Trading with NexTrader Charts
Avoiding these common mistakes will significantly enhance your deriv chart analysis and improve consistency. NexTrader Charts offers professional-grade technical analysis features, completely free. Stop making costly errors and start trading smarter.
Explore the power of free Deriv charting and analysis today: NexTrader Charts
Ready to take your trading to the next level? Sign up for more free Deriv trading tools: Sign Up Free — Nextrader
Join our vibrant community for discussions and insights: Telegram
Trading involves risk. Past performance does not guarantee future results.