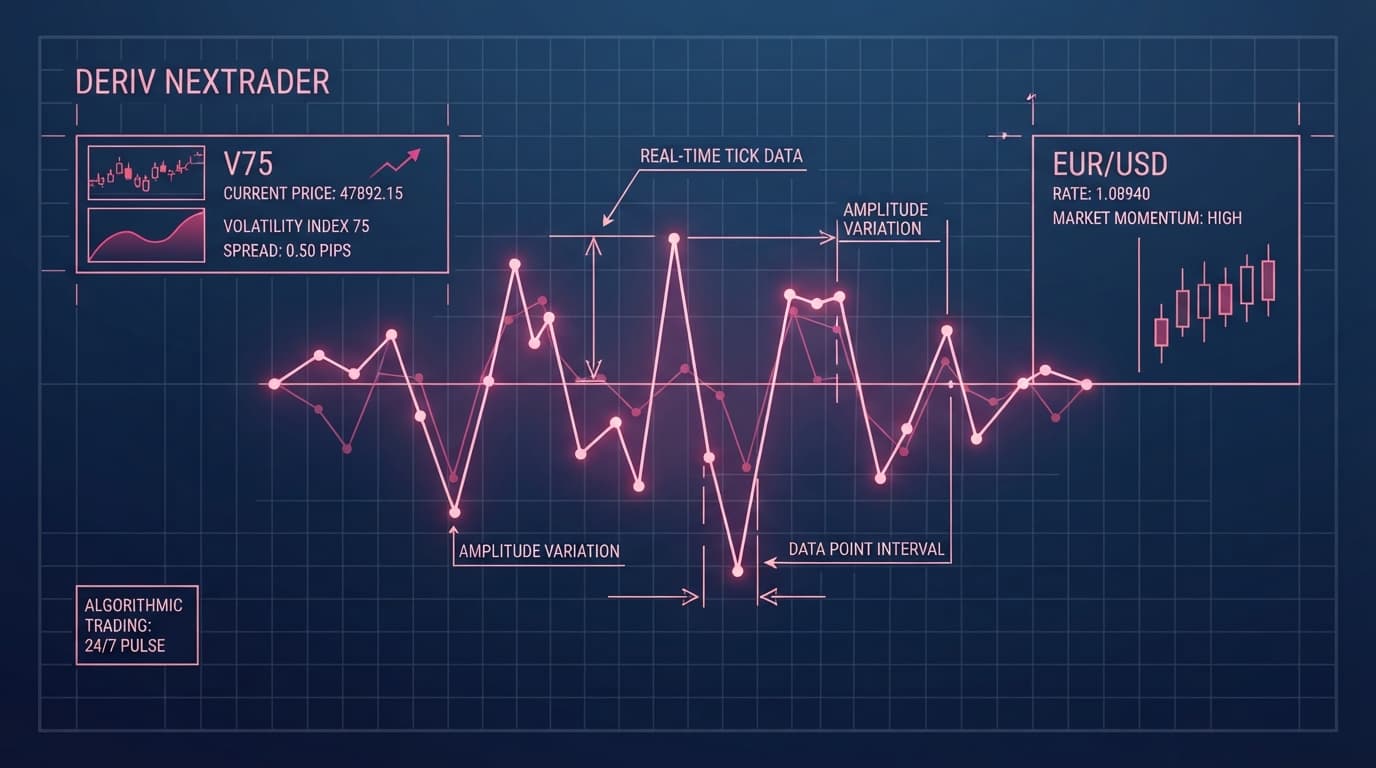
Default Ichimoku settings are not sacred constants. Goichi Hosoda developed the indicator for Japan's 1930s stock exchange, which operated six days a week. Applying a standard 9-26-52 configuration when configuring the ichimoku cloud deriv setup on synthetic indices like Volatility 75 (V75) inevitably leads to premature entries and false Kumo breakouts. Synthetic algorithms generate constant price ticks without weekend halts or market opens, causing traditional lookback periods to break down into chaotic signal noise.
To build a sustainable trading edge, your technical indicator parameters must align with the uninterrupted cycles of 24/7 synthetic price feeds. Recalibrating your indicator parameters to 12-24-120 directly on NexTrader Charts recalculates Kumo boundaries, baseline balances, and lag confirmation to fit continuous market mechanics. This recalibration smooths out algorithm-generated whipsaws on the Volatility 75 Index and Volatility 75 1s Index without sacrificing timely entry signals.
Widening the lookback window expands Kumo boundaries on 1-hour Volatility 75 deriv charts, preventing brief algorithmic price spikes from triggering false breakout entries. Utilizing professional, free NexTrader deriv trading tools ensures you view clean price structure across all volatility instruments without paying for expensive indicator suites or third-party add-ons.
Why Traditional 9-26-52 Settings Fail on 24/7 Volatility 75
Understanding why standard Ichimoku inputs fail on synthetic indices requires examining their historical math. Goichi Hosoda designed the classic parameters based on Japanese equity market schedules in the mid-20th century:
Analyze Deriv Markets Free
Pro-grade Deriv charts with 100+ indicators — RSI, MACD, Bollinger, Ichimoku. Synthetic indices, forex & crypto.
- 100+ Indicators
- Price Alerts
- All Timeframes
- Free Forever
- Tenkan-sen (9 periods): Represented one and a half working weeks (6-day work weeks).
- Kijun-sen (26 periods): Represented one full business month (26 working days).
- Senkou Span B (52 periods): Represented two full business months (52 working days).
When applied to a continuous 24/7 asset like Deriv's Volatility 75 Index, these 1930s Japanese stock settings lose their structural logic. Synthetic indices do not close at 5:00 PM EST, nor do they halt for weekends. An algorithm streams pricing ticks 86,400 seconds a day, 365 days a year.
On a 1-hour chart, a 52-period Senkou Span B represents just 52 hours (roughly 2.1 days). This brief window is far too narrow to calculate a true medium-term equilibrium for an asset that never stops trading. Because the lookback window is compressed relative to a continuous market cycle, the traditional Kumo cloud shrinks into a paper-thin barrier. Volatility 75 algorithms frequently drive price through these narrow default clouds, triggering false breakout signals that reverse instantly.
Recalibrating your inputs to 12-24-120 directly restores mathematical alignment with continuous 24-hour cycles:
- Tenkan-sen (12 periods): Captures exactly half of a 24-hour cycle on the 1-hour timeframe (12 hours).
- Kijun-sen (24 periods): Represents one complete 24-hour daily cycle on the 1-hour timeframe (24 hours).
- Senkou Span B (120 periods): Measures exactly 5 full 24-hour trading days (120 hours), providing a stable 5-day equilibrium boundary.
- Chikou Displacement (24 periods): Shifts the lagging line back by one full 24-hour day to confirm structural breakouts against historical price action.
Expanding Senkou Span B from 52 to 120 periods on NexTrader Charts thickens the Kumo cloud, filtering out short-term algorithmic spikes while preserving strong multi-day trend definitions on Volatility 75.
Step-by-Step Technical Analysis Setup on NexTrader Charts
Configuring custom Ichimoku parameters on NexTrader Charts requires only a few clicks inside the free NexTrader Charts suite at NexTrader Charts.
Step 1: Launch the Asset and Select Your Timeframe
Navigate to NexTrader Charts and open the instrument selector. Search for Volatility 75 Index or Volatility 75 (1s) Index. Set your primary chart timeframe to 1 Hour (1H) for core multi-day structure analysis.
Step 2: Load the Ichimoku Cloud Indicator
Click on the Indicators icon in the top toolbar. Type "Ichimoku Cloud" into the search bar and select it. The default 9-26-52 plot will render over your price action.
Step 3: Modify Inputs to 12-24-120
Click the gear icon next to the Ichimoku indicator label on your chart to open the settings panel. Adjust the parameters in the Inputs tab to match the following configuration:
- Conversion Line (Tenkan-sen): Change
9to12 - Base Line (Kijun-sen): Change
26to24 - Leading Span B (Senkou Span B): Change
52to120 - Lagging Span Displacement (Chikou): Change
26to24
Click OK. You will immediately notice the Kumo cloud widen significantly, absorbing random historical spikes and establishing clear, actionable support and resistance zones.
Step 4: Add Technical Analysis Tools and Save Your Template
Use the native drawing tools on NexTrader Charts to draw horizontal support and resistance lines along the upper (Senkou Span A) and lower (Senkou Span B) boundaries of the recalibrated cloud.
To avoid re-entering these numbers whenever you switch markets, click the Templates button on the top toolbar, select Save Indicator Template, and name it Deriv 24/7 Ichimoku (12-24-120). Now you can apply this custom template instantly across V10, V25, V50, V75, and V100.
Step 5: Set Kumo Boundary Price Alerts
Right-click directly on key Kumo cloud edges or baseline levels on NexTrader Charts and choose Add Alert. Configure a price notification to fire when V75 crosses out of the 120-period cloud boundary, keeping you informed of major structural breakouts without needing to monitor screen feeds constantly.
Mastering NexTrader Chart Analysis with Kumo Breakouts
Executing successful deriv chart analysis on NexTrader requires a structured top-down workflow across multiple timeframes to confirm momentum before committing capital.
Higher Timeframe Context (4-Hour to 1-Hour)
Before opening lower-timeframe positions, evaluate the thickness and direction of the Kumo cloud on the 1-Hour and 4-Hour charts:
- Thick Cloud Environment: Indicates strong market memory and powerful multi-day support/resistance. Expect clean trend continuations upon breakout.
- Kumo Twist Evaluation: A twist in the 120-period Senkou Span B indicates equilibrium shifts. When Span A crosses Span B from below, bias flips bullish; when it crosses from above, bias flips bearish.
- Kijun-sen (24) Baseline Slope: The 24-period baseline acts as dynamic support/resistance. A flat Kijun-sen indicates price consolidation, while a sharply sloping line confirms aggressive trend acceleration.
Lower Timeframe Execution (15-Minute)
Once macro direction is established, drop to the 15-minute timeframe to pinpoint low-risk trade entries. Look for the following precise alignment before entering:
- Price Action: The 15-minute price candle must close completely outside the 12-24-120 Kumo cloud boundary. Avoid entering while price is inside the cloud matrix.
- Tenkan/Kijun Alignment: The 12-period Tenkan-sen must be positioned above the 24-period Kijun-sen for long trades (or below for short trades).
- Chikou Span Confirmation: The 24-period Lagging Span must be completely clear of historic price candles from 24 periods prior, confirming open space for price expansion.
If price breaks out of the cloud on the 15-minute timeframe while the 1-hour Kumo cloud is thick and sloped in the same direction, false breakout probabilities drop dramatically compared to default settings.
Do's and Don'ts for Trading Synthetic Kumo Breakouts
To maintain consistency when trading continuous volatility indices on NexTrader Charts, stick to these rules:
- DO set your Senkou Span B lookback to 120 on NexTrader Charts to reflect 5 full 24-hour cycles on 1-hour charts.
- DON'T rely on standard 52-period defaults that trigger false breakout signals during high-volatility synthetic cycles.
- DO wait for price to close fully outside a thick 12-24-120 Kumo cloud on 15m+ timeframes before entering V75 trades.
- DON'T enter trades inside thin Kumo clouds where synthetic algorithms frequently chop price back and forth.
- DO use NexTrader Charts' built-in template saving feature to lock in your custom 12-24-120 parameters across all synthetic indices (V10–V100).
- DON'T manually reconfigure indicator inputs every time you switch between synthetic volatility assets.
- DO cross-confirm Kumo breakouts with Kijun-sen (24) slope alignment and drawing tools (S/R line breaks) inside NexTrader Charts.
- DON'T trade isolated Tenkan-sen/Kijun-sen crosses that occur within the cloud boundaries.
Upgrade Your Charting Workflow on NexTrader
Launch your analysis today on NexTrader Charts to set up your free 12-24-120 Ichimoku templates, configure custom price alerts, and access professional-grade tools at no cost. Create your free account ecosystem at NexTrader Signup and connect with thousands of active synthetic index traders in our official Telegram.
Trading involves risk. Past performance does not guarantee future results.