Matches and Differs Analysis Tool: Last-Digit Distribution & Streak Thresholds
A matches and differs analysis tool evaluates raw tick streams to track real-time digit distributions across synthetic indices. Synthetic markets like Volatility 10, 25, 50, 75, and 100 generate continuous price ticks where the final decimal digit determines contract outcomes. While each digit from 0 to 9 maintains a theoretical 10% probability on any individual tick, short-term sample windows frequently display localized digit clustering and extended cold streaks.
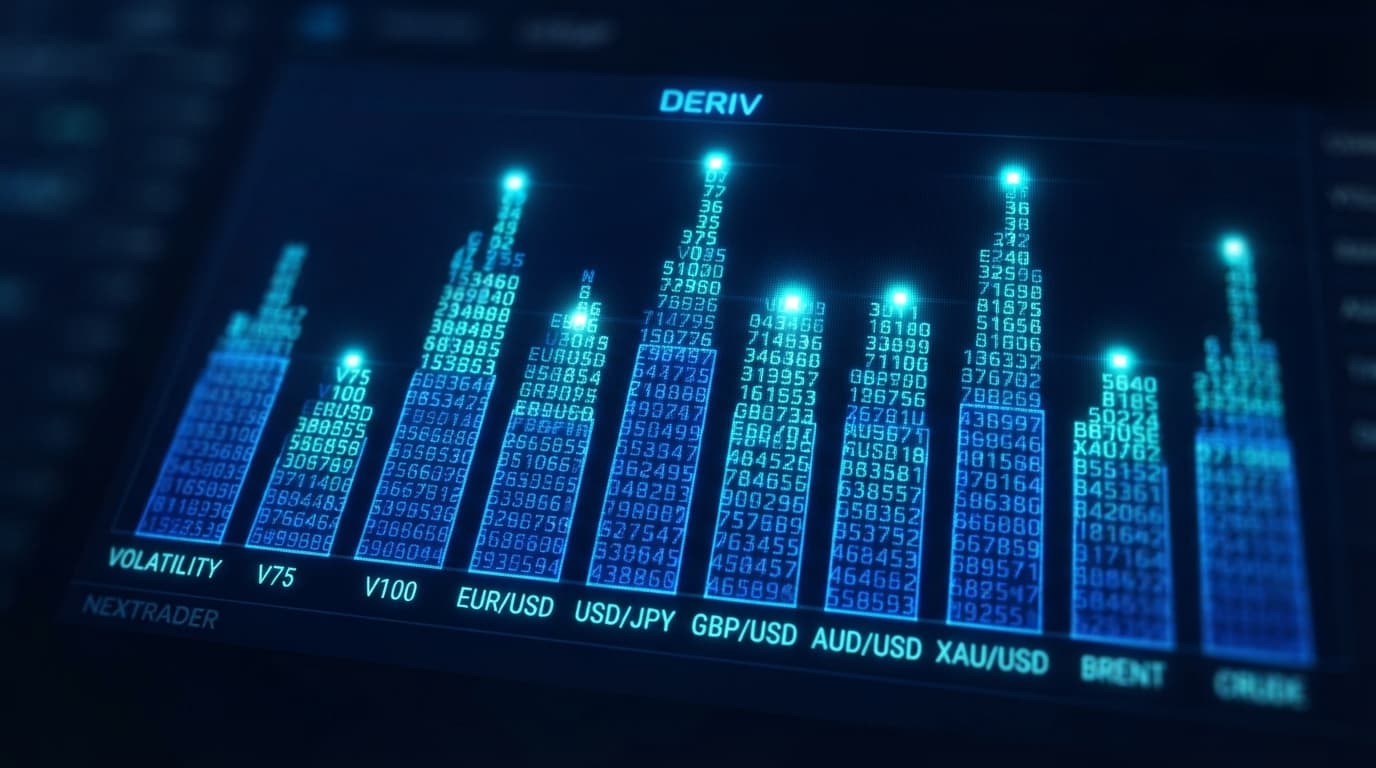
Evaluating tick history through specialized deriv trading tools and real-time deriv trading signals helps traders analyze digit distribution patterns without relying on manual tracking. Over thousands of ticks, digit outcomes tend toward equal distribution. Across compressed sample sizes of 50 to 500 ticks, however, specific digits frequently display temporary frequency shifts or consecutive repeats. A dedicated last-digit analyzer tracks these tick patterns in real time, calculating exact percentage frequencies, streak counts, and distribution metrics across DIGITEVEN/ODD, OVER/UNDER, MATCH, and DIFF contract options.
Instead of manually logging tick outcomes in external spreadsheets or writing block scripts inside DBot (Deriv Bot), tick traders monitor live distributions through direct WebSocket integrations. The Nextrader ecosystem provides these analysis capabilities natively within the free Nextrader App, combining real-time digit analytics and ai trading signals with quick-execution contract panels inside the Digit Trader module.
The 60-Second Version
- Connect your Deriv account via API token to the Nextrader App (Nextrader App) and open the Digit Trader tab.
- Select a high-liquidity synthetic market, such as the Volatility 100 Index or Volatility 75 (1s) Index.
- Set the digit analyzer history parameters to compare a 500-tick baseline against a 50-tick micro-sample.
- Identify frequency shifts (e.g., a digit registering above 18% or below 4% occurrence) or streak counts (3+ identical consecutive digits).
- Execute a DIFF trade on elevated digits or a MATCH trade on cold digits showing recent tick appearances directly on the platform interface.
Before You Begin
- Account & API Integration: You need an active Deriv account linked to Nextrader App using a read/trade WebSocket API token.
- Risk & Capital Management: Maintain adequate balance to manage stake sizes, especially when running high-frequency tick contracts.
- Platform Navigation: Locate the Digit Trader interface inside Nextrader to access real-time last-digit stats without needing third-party charting software or external code.
The Walkthrough: Using the Matches and Differs Analysis Tool
Step 1: Launch Nextrader Digit Trader and Select Synthetic Market
Navigate to Nextrader App and select Digit Trader from the main menu. This module pulls tick data directly from Deriv's WebSocket feeds, eliminating latency in last-digit distribution tracking.
Get Live AI Trading Signals
Real-time non-repaint signals from 11 AI strategies — Volatility Indices, Forex, Gold & Crypto. No subscription, no paywall.
- Auto Trader Bot
- Digit Trader Bot
- 11 AI Strategies
- Live Telegram Signals
Choose a synthetic asset from the market dropdown. Volatility Indices (V10, V25, V50, V75, V100) along with their 1s / 1Hz variants provide the ideal environment for digit analysis due to their continuous, algorithmically generated tick output. Standard volatility indices update every 2 seconds per tick, whereas 1s/1Hz variants generate exactly 1 tick per second. Select an index with consistent tick flow to ensure your history window populates without interruption.
Step 2: Configure Digit History Sample Sizes (50 vs. 500 Ticks)
The core mechanism of a reliable matches and differs analysis tool is multi-timeframe tick evaluation. Looking at a single sample size gives an incomplete picture. A digit might look "hot" over 20 ticks simply due to small-sample variance, while remaining completely balanced over a longer horizon.
- Adjust the primary history analyzer to 500 ticks. Over 500 ticks, the theoretical probability distribution approaches a horizontal mean, where each digit from 0 to 9 accounts for roughly 10% (50 appearances) of total outcomes. This 500-tick window serves as your baseline sample.
- Toggle the sample window to 50 ticks to inspect immediate short-term momentum. The 50-tick view highlights localized clustering, sudden frequency surges, and real-time cold spots.
- Compare the two sample sizes. Look for divergence where the 50-tick short-term distribution deviates noticeably from the 500-tick baseline.
Step 3: Isolate Frequency Anomalies and Streak Thresholds
Once your sample parameters are set, scan the visual frequency charts and streak counters for explicit distribution shifts:
Differs Setup (High-Frequency Observations)
- Frequency Shifts: Look for a single digit whose appearance rate reaches 15% to 20% over the last 50 ticks, while sitting near the expected 10% average on the 500-tick baseline. A digit appearing 10 times in 50 ticks represents temporary overrepresentation relative to its long-term average. Traders using DIFF contracts (predicting the next tick will not match this digit) observe these high-frequency spikes to identify short-term statistical concentration.
- Streak Thresholds: Monitor the streak counter for consecutive digit repeats. In a uniform 10-digit random distribution, the probability of the same digit appearing twice in a row is 1% (0.10 x 0.10), three times is 0.1%, and four times is 0.01%. When a digit reaches a streak of 3 or 4 consecutive ticks, placing a DIFF contract targets ticks following rare repeat sequences.
Matches Setup (Cold Digit Turnaround)
- Cold Digit Monitoring: Search the 500-tick baseline for low-frequency cold digits occurring at under 3% to 4% total frequency (fewer than 15-20 appearances in 500 ticks).
- Trigger: Rather than selecting a cold digit blindly, wait until the 50-tick sample shows the digit registering 2 appearances within the last 10 ticks. This shift indicates that the cold digit is returning to recent tick activity. MATCH contracts pay out higher multipliers when the selected digit matches the outcome tick.
Step 4: Execute MATCH or DIFF Contracts via Nextrader
With your target digit isolated through distribution analysis, prepare execution inside the Nextrader interface:
- Select the MATCH or DIFF tab within Digit Trader.
- Select your target digit (0 through 9).
- Set the contract duration in ticks (typically 1 to 5 ticks based on trade setup).
- Enter your base stake amount.
- Click MATCH or DIFF to send the trade order instantly via your WebSocket connection.
Traders often attempt to run these strategies using deriv bots or custom XML scripts inside DBot (Deriv Bot). While DBot allows users to build logic blocks and run strategies on a demo account, setting up dynamic dual-timeframe sample comparisons (50 vs. 500 ticks) requires complex manual block assembly. The Nextrader App displays these real-time metrics automatically on screen inside the Digit Trader interface, allowing you to monitor live distributions without managing block scripts.
What Can Go Wrong
1. Trading on Low Sample Sizes Alone
Analyzing only a 50-tick window without referencing the 500-tick baseline can mislead analysis. A digit appearing 8 times in 50 ticks might seem overrepresented, but if it appeared only twice in the preceding 450 ticks, it is simply aligning with its long-term distribution. Always evaluate short-term shifts alongside the broader 500-tick baseline.
2. Chasing Differs Contracts During Outlier Streaks
Differs contracts offer lower payout percentages per win compared to Matches contracts. If you enter a DIFF trade after a 3-digit streak and the tick stream extends that streak to 6 or 7 consecutive ticks, increasing stake sizes without a strict loss limit can rapidly deplete capital. Always enforce fixed loss limits and avoid aggressive stake multipliers during extended statistical outliers.
3. Disregarding Market Tick Speeds Across Indices
Evaluating a 50-tick sample on standard Volatility 100 takes 100 seconds (1 tick every 2 seconds). On Volatility 100 (1s), that same 50-tick sample represents just 50 seconds. Ensure you adjust your trade timing and execution speed to match the specific tick generation rate of the synthetic asset you are trading.
Start Now
Stop guessing last-digit outcomes on synthetic markets. Launch the Nextrader App at Nextrader App to access the full suite of digit analysis tools and quick-execution contract panels. Link your account at Sign Up Free — Nextrader, navigate directly to Digit Trader, and configure your history depth to compare 50-tick micro trends against 500-tick baseline distributions.
For continuous strategy discussion, operational tips, and direct feedback from active market participants, join our official Telegram community at Telegram.
Trading involves risk. Past performance does not guarantee future results.