
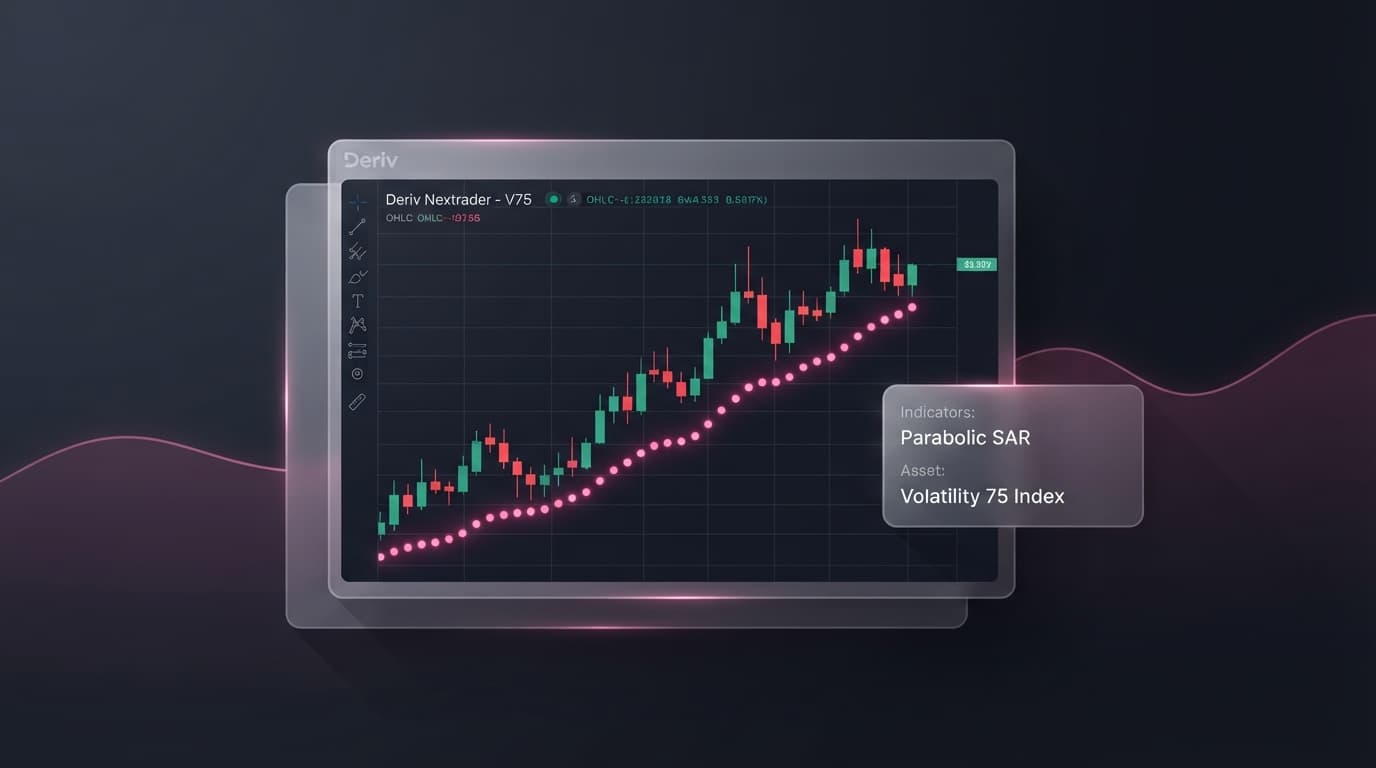
Applying a Parabolic SAR strategy to synthetic indices and forex markets requires filtering entries with a 200-period Exponential Moving Average (200 EMA) and adjusting acceleration parameters to 0.01 step and 0.10 maximum on NexTrader Charts (NexTrader Charts). This configuration helps reduce whipsaws during minor price pullbacks while establishing dynamic trailing stops.
Finding a reliable trend-following framework across fast-moving synthetic assets like Volatility 75 (V75) Index or Volatility 100 (V100) Index requires adjustments to default indicator settings. The Parabolic Stop and Reverse (PSAR) indicator calculates potential price direction and dynamic trailing stop levels, but its standard values often react too aggressively when short-term volatility surges.
To build a structured charting workflow for currency pairs and 24/7 synthetic indices provided by Deriv, technical traders can modify the indicator's step and maximum acceleration rates. Using NexTrader Charts (NexTrader Charts) gives traders the tools needed to tune these parameters, analyze price action, and monitor dynamic exit points across timeframes ranging from 1-minute to monthly charts.
Optimizing Your Parabolic SAR Strategy: Standard (0.02/0.20) vs. Synthetic-Optimized (0.01/0.10)
The default PSAR configuration relies on an initial step factor of 0.02 and a maximum acceleration limit of 0.20. In lower-volatility conditions or slow-moving forex pairs like EUR/USD and GBP/USD, these values allow the indicator to follow price action without triggering frequent exit flips. However, synthetic index markets behave differently. Assets like V75 and V100 feature rapid price movements 24 hours a day, 7 days a week. Under default 0.02/0.20 parameters, temporary multi-candle retracements can force the PSAR dots to flip to the opposite side of the candle, interrupting position management during ongoing trends.
Analyze Deriv Markets Free
Pro-grade Deriv charts with 100+ indicators — RSI, MACD, Bollinger, Ichimoku. Synthetic indices, forex & crypto.
- 100+ Indicators
- Price Alerts
- All Timeframes
- Free Forever
By dampening the indicator's step to 0.01 and tightening the maximum acceleration cap to 0.10, the dynamic trailing dots advance at half their default rate. This adjustment gives price swings additional breathing room during active expansions on 5-minute and 15-minute chart intervals. Rather than reacting to minor pullback spikes on V75 or V100, the 0.01/0.10 setting maintains its trailing trajectory below support (or above resistance) until a macro trend reversal occurs.
A standalone Parabolic SAR setup remains susceptible to false signals during range-bound, sideways consolidation because the dots alternate directions without sustained price progression. To reduce exposure during range-bound conditions, a 200-period Exponential Moving Average (EMA) acts as a structural trend filter. Long entries are evaluated only when price trades above the 200 EMA, while short entries are evaluated only when price trades below the 200 EMA. If the 200 EMA moves horizontally through the center of price action, market direction is unconfirmed, and trading activity is paused.
Executing this setup requires responsive visual analysis. On NexTrader Charts (NexTrader Charts), traders can add both the Parabolic SAR and the 200 EMA directly onto real-time data feeds for synthetic indices and forex markets. The platform supports full parameter customization: users can open indicator settings, set the PSAR step to 0.01 and max acceleration to 0.10, adjust 200 EMA visual styles, and save custom layout templates. Beyond PSAR and EMA, NexTrader Charts includes over 100 technical indicators—such as RSI, MACD, Bollinger Bands, Moving Averages, Stochastic, Ichimoku, and Fibonacci tools—enabling multi-indicator confluence checks on a 100% free platform.
Strategy Parameter Comparison
| Parameter / Metric | Standard Forex Setup | Synthetic Indices Setup (V75 / V100) |
|---|---|---|
| PSAR Step Rate | 0.02 | 0.01 |
| PSAR Max Acceleration | 0.20 | 0.10 |
| Trend Filter | 200 EMA | 200 EMA |
| Optimal Timeframes | 15-Minute / 1-Hour | 5-Minute / 15-Minute |
| Market Availability | 5 days/week | 24/7 / 365 days |
| Primary Charting Tool | NexTrader Charts | NexTrader Charts |
Executing Trailing-Stops Using Advanced Deriv Trading Tools
To execute this technical setup, traders can apply a structured multi-step entry and risk-management process directly within NexTrader Charts.
Step 1: Macro Direction Identification
Begin by loading the 5-minute or 15-minute chart on NexTrader Charts (NexTrader Charts). Observe the direction of the 200 EMA line and the position of current price candles relative to it. If price sits above an upward-sloping 200 EMA, focus exclusively on buy setups. Conversely, if price trades below a downward-sloping 200 EMA, focus on sell setups. Performing technical analysis across multiple timeframes helps align trade selection with the dominant trend.
Step 2: Precise Signal Confirmation
Once directional alignment with the 200 EMA is confirmed, monitor for the entry trigger:
- Bullish Entry: Price trades above the 200 EMA. Wait for the trailing dots to flip from above the candles to printing the first dot below the active candle.
- Bearish Entry: Price trades below the 200 EMA. Wait for the trailing dots to flip from below the candles to printing the first dot above the active candle.
Wait for the signal candle to close on NexTrader Charts to verify that the dot placement remains fixed before acting.
Step 3: Dynamic Risk Management and Trailing Stop Execution
Risk placement uses the active PSAR level. At the open of the candle immediately following the dot flip, set your initial stop loss at the exact price value of the primary PSAR dot. As subsequent candles complete, the PSAR dot moves along the price trajectory. Adjust your protective stop-loss level to match the updated PSAR value on each completed candle.
To manage position monitoring on 24/7 markets like Volatility 75 or Volatility 100 Index, use the built-in price alert tools on NexTrader Charts (NexTrader Charts). Setting alerts at key PSAR barrier levels provides instant visual notifications when price approaches trailing thresholds.
Step 4: Record-Keeping and Community Validation
Documenting technical setups builds systematic execution habits over time. NexTrader Charts includes drawing tools, trendlines, support/resistance markers, price alert tools, and high-resolution chart screenshot capabilities. Capture visual records of entries, trailing stop adjustments, and trade exits directly from the workspace. You can share annotated chart screenshots in the Nextrader Telegram community at Telegram to compare technical structures with other synthetic indices and forex traders.
Aligning Parabolic SAR parameters with asset volatility helps manage trade exits on synthetic indices like Volatility 75 and Volatility 100 Index as well as major forex pairs. Applying a 200 EMA trend filter alongside customized 0.01 step and 0.10 maximum acceleration values on NexTrader Charts (NexTrader Charts) establishes a systematic structure for dynamic trailing stops.
Traders can access real-time synthetic indices and forex charting, apply technical indicators, and set custom price alerts for free on NexTrader Charts (NexTrader Charts), with community discussion available at Telegram.
Trading involves risk. Past performance does not guarantee future results.