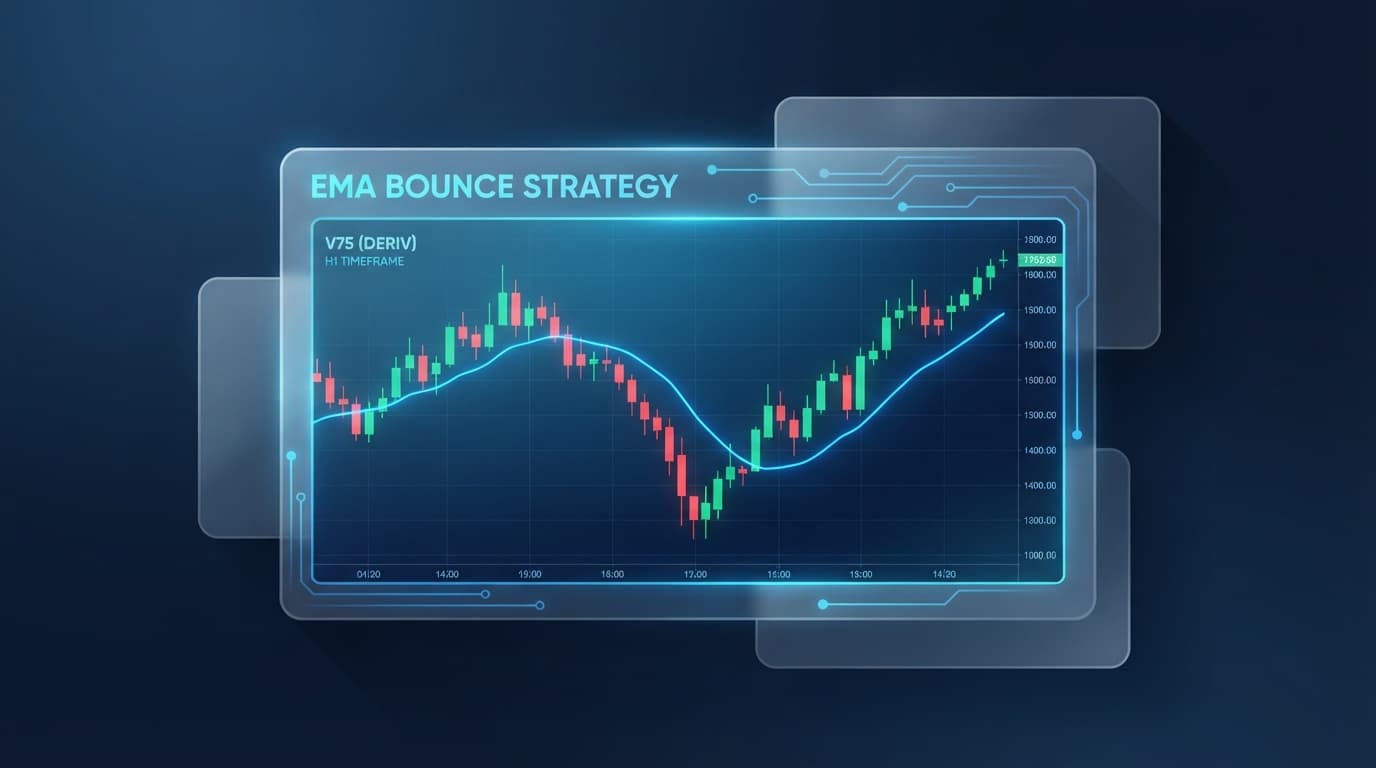

On a 5-minute chart of the Volatility 75 (1s) Index, a trader executes a $50 Rise trade with an x100 multiplier right as the candle closes with RSI(2) hitting 8.4 above the 200 EMA. Within three candles, price surges back to the mean, hitting the pre-filled Take Profit target.
Standard technical indicators like the classic 14-period Relative Strength Index often react too slowly to ultra-fast synthetic movements. By contrast, the rsi 2 strategy targets rapid pullbacks in trending markets before the original momentum resumes.
Instead of waiting hours for a delayed overbought or oversold signal, traders use this 2-period mean-reversion model to spot temporary exhaustion. Automating this setup with ai trading signals allows traders to scan live closed candles continuously on Nextrader App across V75, V100, and major forex pairs without watching charts manually.
1. Core Mechanics: Pairing RSI(2) Extremes with the 200 EMA Trend Filter
The 2-period Relative Strength Index, originally popularized by Larry Connors, relies on an aggressive mathematical formula. Because the calculation looks back over only two candles, the oscillator reaches extreme levels rapidly. A single strong bearish candle during a dominant uptrend will drive the RSI(2) deep into oversold territory, signaling an immediate entry opportunity before the primary trend re-engages.
Get Live AI Trading Signals
Real-time non-repaint signals from 11 AI strategies — Volatility Indices, Forex, Gold & Crypto. No subscription, no paywall.
- Auto Trader Bot
- Digit Trader Bot
- 11 AI Strategies
- Live Telegram Signals
- 1 Identify primary trend direction using the 200 EMA on 5m or 15m timeframe
- 2 Wait for RSI(2) to breach extreme thresholds (<= 10 oversold, >= 90 overbought)
- 3 Confirm closed candle alert inside Nextrader App without repainting risk
- 4 Execute trade with auto-populated ATR Stop Loss and Take Profit in Quick Trade
To prevent taking bad counter-trend trades during high-volatility sell-offs, the strategy imposes strict trend and momentum parameters:
- The Trend Anchor (200 Exponential Moving Average): Long positions are permitted only when market price trades strictly above the 200 EMA. Short positions are permitted only when market price trades strictly below the 200 EMA. This prevents taking mean-reversion trades against a strong trend.
- Extreme RSI(2) Thresholds: Standard 70/30 levels fail on a 2-period lookback because price crosses them too often. The strategy uses 90 for overbought condition (Sell trigger) and 10 for oversold condition (Buy trigger).
- Dynamic ATR Risk Containment: Profit targets and stop-loss boundaries depend on real-time volatility. Using ATR-based parameters provided by strategies like Breakout Beast, trade exits expand during fast market conditions and tighten when volatility shrinks.
When an RSI(2) reading drops below 10 while price stays above the 200 EMA on the Volatility 75 (1s) Index or EUR/USD, the setup marks a short-term oversold dip within an established uptrend.
2. Nextrader AI Signals: Scanning Non-Repainting Setups via Reversal Radar
Monitoring multiple synthetic indices alongside major forex pairs for brief RSI(2) extremes requires automation. Setting up basic deriv trading tools or calculating dynamic ATR bands manually creates execution delays.
Target algorithms inside Nextrader App at Nextrader App simplify this workflow by scanning live market feeds directly via Deriv’s WebSocket API to deliver real-time deriv trading signals on 1m, 5m, 15m, and 1h candle timeframes.
When scanning for the rsi 2 strategy, the platform looks for alignment between multiple named AI strategies. The app generates a dedicated Signal Card when conditions line up:
- Reversal Radar identifies short-term RSI(2) exhaustion at the 10 or 90 boundaries.
- Trend Hunter validates that the higher-timeframe 200 EMA supports the proposed direction (UP above 200 EMA, DOWN below 200 EMA).
- Breakout Beast evaluates recent candle volatility to set ATR-based risk levels.
A critical design choice of Nextrader's scanner is non-repainting execution. A signal card generates only when a candle closes. If an intraday spike drops RSI(2) to 9 during an active 5-minute candle, no signal fires until that candle closes with the condition intact. This eliminates repainting errors where historical signals vanish after the market moves.
Traders can review the signal's confluence percentage, direction (UP or DOWN), strength tag (STRONG), and timeframe before taking action. Every card shows exact underlying indicator agreement, giving you complete context behind the trade trigger.
3. Executing RSI(2) Trades with Quick Trade
Once a valid signal card appears on the Nextrader App interface, speed and precision are critical. Market noise on high-volatility assets like synthetic indices can turn a high-confluence pullback into a missed move in seconds.
Clicking directly on a Reversal Radar signal card on Nextrader App immediately opens a trade confirmation modal. This interface calculates suggested stake sizes based on risk parameters and automatically pre-fills risk boundaries.
The app's Quick Trade panel connects these strategy parameters directly to market execution:
- Contract Selection: Choose between Multipliers (e.g., x100 multiplier) or Rise/Fall options. Multipliers capture swift mean-reversion surges while capping maximum loss at your chosen stake.
- Automated Stop Loss & Take Profit: The app pre-fills target levels calculated from dynamic ATR data directly into the Stop Loss and Take Profit fields from the active AI signal card.
- One-Click Execution: Review the suggested stake, risk-to-reward ratio, and confluence score, then hit UP or DOWN to place the order instantly.
Active position management takes place inside the Active Trades table. The dashboard displays real-time tick updates and active P/L calculations. If price action stalls or market structure shifts before reaching your full Take Profit target, you can manually close the contract early to secure profits or cap drawdown.
Step-by-Step RSI(2) Trading Workflow
To implement this complete setup efficiently, follow this practical checklist on the Nextrader ecosystem:
- Launch the App: Open Nextrader App and log into your connected account.
- Filter Timeframes: Navigate to the Signals tab and select the 5m or 15m candle view.
- Filter Strategy Cards: Look for active Reversal Radar signal cards marked with STRONG signal strength and high confluence percentages on synthetic indices (like V75 1Hz) or forex pairs (such as EUR/USD).
- Verify Indicator Confluence: Open the signal card details to ensure Trend Hunter (200 EMA) confirms the primary trend while RSI(2) reports extreme oversold (≤ 10) or overbought (≥ 90) conditions on a fully CLOSED candle.
- Load Quick Trade: Click the signal card to open the Quick Trade window. Check the pre-filled Take Profit and Stop Loss values derived from the AI signal's ATR calculations.
- Set Stake & Multiplier: Enter your desired stake, set your leverage parameter (such as x100 on Multipliers), and click UP or DOWN to execute.
- Monitor Live Position: Watch active performance via the Active Trades table, allowing dynamic target levels to close the trade or taking early profits if momentum stalls.
If you are new to automated scanners and signals, step-by-step guides are available directly via official resources like Nextrader App and Nextrader App.
Strategy Execution on Nextrader
Pairing 2-period RSI extremes with a 200 EMA trend filter provides clear rules for trading synthetic indices and forex markets. Filtering entries against the primary trend and applying dynamic ATR exits keeps risk parameters systematic on every trade setup.
Nextrader handles the continuous market scanning, indicator calculations, and trade sizing directly within Nextrader App, serving as a powerful alternative to traditional deriv bots. You get non-repainting signal alerts on closed candles and pre-filled Quick Trade execution without managing manual charts.
Start scanning live non-repainting setups today by launching the app at Nextrader App. Create your free account at Sign Up Free — Nextrader, and join our active community of traders on Telegram at Telegram.
Trading involves risk. Past performance does not guarantee future results.