Unlocking Trend Direction: Quick Tips for Interpreting Ichimoku Cloud on Deriv Crash 500 Charts
Navigating the dynamic world of Deriv synthetic indices, especially the volatile Crash 500, demands robust technical analysis. Identifying clear trend direction is paramount for making informed trading decisions, and the Ichimoku Cloud stands out as a comprehensive indicator that offers a wealth of information at a glance. But how do you effectively interpret its signals on your deriv charts?
At NexTrader Charts, you gain access to professional, TradingView-grade charting technology – 100% free – allowing you to apply the Ichimoku Cloud and over 100 other indicators to your Deriv instruments, including Crash 500. This powerful deriv trading tool integrates multiple indicators into a single, cohesive framework, helping traders understand support, resistance, momentum, and most critically, trend direction.
Let's dive into some quick, practical tips to help you interpret Ichimoku Cloud signals specifically on your Deriv Crash 500 charts, harnessing the power of free deriv chart analysis available at NexTrader Charts.
Mastering the Ichimoku Cloud on Nextrader Charts
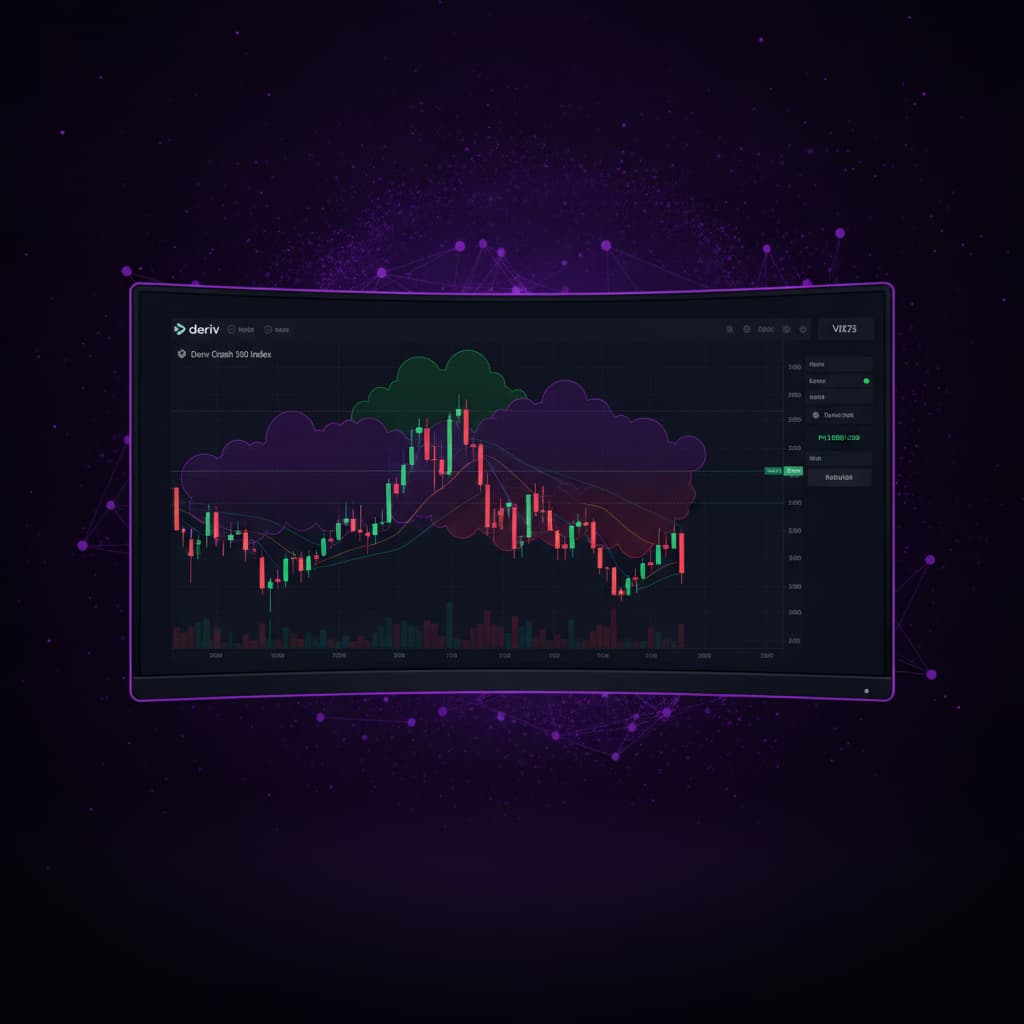
The Ichimoku Cloud, or Ichimoku Kinko Hyo, consists of five lines, but the most visually prominent and often the easiest to interpret is the "Kumo" or Cloud itself. On Nextrader Charts, you'll see this shaded area, which represents future support and resistance, as well as indicating trend direction and strength.
Analyze Deriv Markets Free
Pro-grade Deriv charts with 100+ indicators — RSI, MACD, Bollinger, Ichimoku. Synthetic indices, forex & crypto.
- 100+ Indicators
- Price Alerts
- All Timeframes
- Free Forever
- Kumo (Cloud): The heart of Ichimoku. A green cloud typically indicates a bullish trend, while a red cloud suggests a bearish trend. Its thickness also matters: a thick cloud indicates strong support/resistance, while a thin cloud suggests weaker levels and potentially easier breakouts.
- Tenkan-sen (Conversion Line): The average of the highest high and lowest low for the past 9 periods. It acts like a fast-moving average.
- Kijun-sen (Base Line): The average of the highest high and lowest low for the past 26 periods. It acts like a slower-moving average and is a stronger indicator of trend.
- Chikou Span (Lagging Span): The current closing price plotted 26 periods back. It helps confirm price action and identify momentum.
- Senkou Span A & B (Leading Spans): These form the boundaries of the Kumo (Cloud), projected 26 periods into the future.
All these components are readily available and customisable on Nextrader Charts, providing a comprehensive view for your deriv chart analysis.
Quick Tips for Deriv Crash 500 Trend Identification
Interpreting the Ichimoku Cloud on volatile instruments like Crash 500 requires a keen eye for specific interactions:
- Price Position Relative to the Kumo:
* Price above the Cloud: A strong bullish signal. If the cloud is also green, the uptrend is robust.
* Price below the Cloud: A strong bearish signal. If the cloud is red, the downtrend is robust. For Crash 500, watch for price consistently staying below a red cloud, indicating continued downward momentum.
* Price inside the Cloud: Indicates consolidation or indecision. This is a zone of uncertainty, and traders often wait for a breakout above or below the cloud for clearer direction.
- Kumo Color Changes (Twists):
* A change from a red cloud to a green cloud signals a potential shift from a bearish to a bullish trend.
* A change from a green cloud to a red cloud signals a potential shift from a bullish to a bearish trend. These "Kumo Twists" are powerful reversal signals, especially when confirmed by price action. On Crash 500, a twist from green to red, combined with price breaking below the cloud, often precedes significant drops.
- Tenkan-sen/Kijun-sen Crosses:
* Bullish Cross: When the Tenkan-sen crosses above the Kijun-sen, it's a short-term bullish signal, indicating increasing momentum.
* Bearish Cross: When the Tenkan-sen crosses below the Kijun-sen, it's a short-term bearish signal, indicating decreasing momentum. These crosses within or near the cloud can foreshadow a trend change, especially if the cloud also begins to twist.
- Chikou Span Confirmation:
* Bullish Confirmation: If the Chikou Span is above the price 26 periods ago and ideally above the Kumo, it reinforces a bullish trend.
* Bearish Confirmation: If the Chikou Span is below the price 26 periods ago and ideally below the Kumo, it reinforces a bearish trend. This lagging indicator provides a final check on the strength and validity of the current trend.
By combining these signals on your free Deriv charts at NexTrader Charts, you can gain a clearer perspective on the trend direction of Crash 500, enhancing your technical analysis and overall trading strategy.
Harness the power of professional technical analysis for free. Explore Ichimoku Cloud and over 100 other indicators on your deriv charts today at NexTrader Charts. Join our growing community at Telegram and consider signing up for more free deriv trading tools at Sign Up Free — Nextrader.
Trading involves risk. Past performance does not guarantee future results.