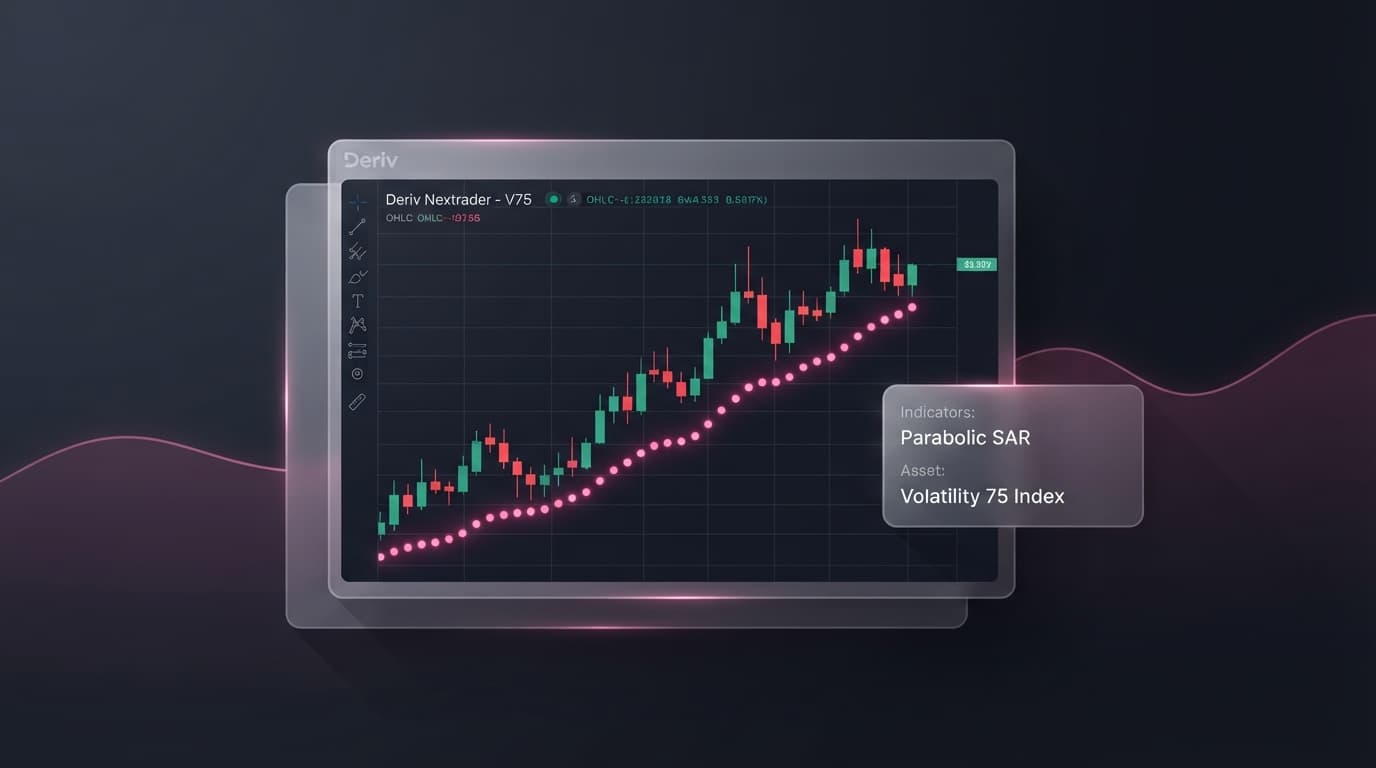

Executing effective xauusd technical analysis demands immediate clarity on spot gold's aggressive price swings. Central bank interest rate announcements, shifts in institutional liquidity, and unexpected macro headlines frequently shatter static horizontal support and resistance lines on lower timeframes. Without multi-timeframe confirmation, trading spot gold on single-timeframe deriv charts leaves your positions vulnerable to sharp liquidity sweeps.
Profitable spot gold strategies rely on establishing high-timeframe trend direction before executing precision entries on lower timeframes. Professional traders isolate macro bias on structural charts like the H4, entering on lower timeframes only when short-term momentum and ATR volatility metrics align with key discount levels.
Using the free NexTrader tools on NexTrader Charts (NexTrader Charts), you can track spot gold price action with professional-grade precision. Direct integration with real-time Deriv price feeds provides access to over 100 technical indicators, deriv trading tools, custom price alerts, and template saving—100% free with no monthly paywalls or subscriptions.
Establishing H4 Trend Baselines on NexTrader Charts
Before placing a single trade on XAUUSD, you must determine who controls the higher timeframe: the buyers or the sellers. Navigating 15-minute price action without high-timeframe context is a primary cause of trader frustration. An M15 bullish engulfing pattern against a strong H4 downtrend is frequently a bull trap designed to grab retail liquidity.
Analyze Deriv Markets Free
Pro-grade Deriv charts with 100+ indicators — RSI, MACD, Bollinger, Ichimoku. Synthetic indices, forex & crypto.
- 100+ Indicators
- Price Alerts
- All Timeframes
- Free Forever
To establish your directional baseline, open NexTrader Charts at NexTrader Charts and select XAUUSD from the instrument menu. Change your chart timeframe to H4 (4-Hour). The 4-hour chart filters out intraday noise while revealing clear structural swings and institutional order flow.
- 1 Set H4 directional bias using 50 EMA and 200 EMA baseline
- 2 Drop to M15 and plot Fibonacci retracements from key impulse swings
- 3 Confirm momentum rejection using 14-period RSI divergence
- 4 Calculate dynamic 1.5x ATR stop-loss buffer and set alerts on NexTrader Charts
Next, open the indicator library on NexTrader Charts and apply two Moving Averages to your H4 chart:
- Fast EMA: Set the length to 50 periods and choose Exponential Moving Average. Color this line blue for easy visual tracking.
- Slow EMA: Set the length to 200 periods and choose Exponential Moving Average. Color this line orange or red.
These two exponential moving averages establish structural bias on NexTrader Charts. On XAUUSD, apply concrete parameters to filter trades:
- Bullish Market Regime: The 50 EMA sits above the 200 EMA, with H4 candle closes holding at least $5.00 above the 50 EMA. Look exclusively for M15 long setups.
- Bearish Market Regime: The 50 EMA sits below the 200 EMA, with H4 candles closing $5.00+ below the 50 EMA line. Focus strictly on M15 short entries.
- No-Trade Consolidation: The EMA distance narrows to under $2.00 on XAUUSD, indicating tight compression prior to high-impact economic releases. Hold off on trade entries until price closes decisively outside the EMA envelope.
Once your H4 baseline is established, click the Save Template icon in the upper toolbar of NexTrader Charts. Name this configuration "H4/M15 Gold MTF". Saving your template ensures that your moving average baselines, custom indicator colors, and technical parameters remain locked into your account session whenever you load spot gold or switch between instruments.
M15 Micro Execution: Technical Analysis with Fibonacci, RSI, and ATR
With your H4 bias locked in, shift your chart timeframe on NexTrader Charts down to M15 (15-Minute). The lower timeframe provides clear entries with tight risk parameters aligned with your macro baseline. If your H4 analysis indicates a bullish trend, your objective on M15 is to wait for price to pull back into a high-confluence discount zone.
Step 1: Mapping Fibonacci Retracement Golden Zones
Select the Fibonacci Retracement drawing tool from the left toolbar on NexTrader Charts. Locate the most recent, prominent M15 impulse swing that aligns with your H4 directional bias.
Target specific Fib levels on XAUUSD M15 impulse swings (typically $15.00 to $30.00 price expansion legs):
- 50.0% Retracement Level: Mark the exact midpoint of an M15 impulse leg. If gold rallies from $2,640.00 to $2,660.00, the 50.0% level sits at $2,650.00.
- 61.8% Retracement Level: Focus primary entry interest at the 61.8% level ($2,647.60 in a $20 move). High-volume institutional limit orders routinely cluster between the 50% and 61.8% zones on gold.
Filter out shallow 23.6% and 38.2% pullbacks on XAUUSD. Spot gold regularly sweeps shallow retracements during New York session opens before reversing at the 61.8% level.
Step 2: Confirming Momentum with RSI Divergence
Load the 14-period Relative Strength Index (RSI) on NexTrader Charts. Rather than taking blind overbought/oversold signals, validate price reaction at your Fibonacci zones with structural divergence:
- Bullish RSI Divergence (Longs): Gold price prints a secondary lower low on the M15 chart into the 61.8% Fib level (e.g., ticking down from $2,648.00 to $2,646.50), while the 14-period RSI prints a higher low below 35. This confirms downside momentum loss as liquidity clears.
- Bearish RSI Divergence (Shorts): Gold pushes to a higher peak into the 61.8% Fib level during an H4 downtrend, but 14-period RSI creates a lower peak above 65, confirming buyer exhaustion before price moves down.
Step 3: Setting Dynamic Risk Buffers with ATR
Gold is notorious for sharp liquidity spikes that clear out tight retail stop losses before resuming the primary trend. Setting a fixed pip stop loss on XAUUSD often leads to unnecessary stop-outs during normal market volatility.
To solve this, add the 14-period Average True Range (ATR) indicator to your M15 chart on NexTrader Charts. The ATR measures actual market volatility in price points over the last 14 candles.
Instead of guessing your stop-loss distance, use a dynamic volatility formula:
$$\text{Stop Loss Distance} = \text{M15 ATR Value} \times 1.5$$
If the M15 ATR reads 4.00 ($4.00 per gold ounce), multiply 4.00 by 1.5 to get a $6.00 dynamic risk buffer. For a long trade entered at $2,650.00 near the 61.8% Fib level, place your stop loss at $2,644.00 (below structural support minus your ATR buffer). This systematic approach accommodates real-time commodity expansion while protecting your margin.
For profit targets, place Take Profit 1 (TP1) at the 0.0% Fibonacci swing high to secure a partial profit and move your stop loss to breakeven. Target the negative -27.2% Fibonacci extension level for Take Profit 2 (TP2) to extract maximum yield from the extension leg.
Execution and Community Integration on NexTrader
Managing risk and charting trades requires an efficient workflow so you never miss a high-probability move. The native features inside NexTrader Charts streamline your session routine:
- Price Alerts: Right-click directly on your 61.8% Fibonacci level on NexTrader Charts and select Set Alert. The web app notifies you instantly when price approaches your entry zone, eliminating the need to stare at charts for hours.
- Visual Chart Export: Use the built-in Screenshot & Sharing Tool located in the top navigation bar to generate an instant link or image of your chart setup, including your H4 EMAs, M15 Fibonacci grid, and RSI divergence signals.
- Community Alignment: Share your visual analysis with active Deriv traders in the official Telegram community at
Telegram. Comparing your setups with experienced commodity traders builds analytical discipline and reinforces execution rules. For traders who also manage currency pairs alongside gold, access real-time trade signals throught.me/nextrader_signals.
Combining high-timeframe trend filters with M15 Fibonacci levels, RSI momentum divergence, and ATR volatility buffers provides a disciplined, rule-based framework for deriv chart analysis on XAUUSD.
Access free charting tools, save custom technical templates, and analyze spot gold price action without subscription paywalls on NexTrader Charts (NexTrader Charts). Load your saved Gold MTF template, track live market feeds, and collaborate with fellow traders inside the official Telegram community at Telegram.
Trading involves risk. Past performance does not guarantee future results.